Journal of Medical Sciences and Health
DOI: 10.46347/jmsh.2022.v8i1.4
Year: 2022, Volume: 8, Issue: 1, Pages: 14-21
Original Article
Anuj Aggarwal1 , Neha Bagri2 , Ranjan Chandra3 , Manisha Bais Thakur4 , Anita Rani5 , Apurva Surana1 , Ayush Khandelwal1
1Senior Resident, Department of Radio-diagnosis, VMMC & Safdarjung Hospital, New Delhi, India,
2Associate Professor, Department of Radio-diagnosis, VMMC & Safdarjung Hospital, New Delhi, India,
3Professor, Department of Radio-diagnosis, VMMC & Safdarjung Hospital, New Delhi, India,
4Professor, Department of Medicine, VMMC & Safdarjung Hospital, New Delhi, India,
5Director Professor, Department of Biochemistry, VMMC & Safdarjung Hospital, New Delhi, India
Address for correspondence: Neha Bagri, Associate Professor, Department of Radio-diagnosis, VMMC & Safdarjung Hospital, New Delhi, India.
E-mail: [email protected]
Background: Differentiation of exudative and transudative types of pleural effusion is crucial for management of patients. Currently, this differentiation is done with the help of biochemical analysis of the aspirated fluid after thoracentesis, which is an invasive procedure. Objective: To evaluate the utility of CT attenuation values in pleural effusion and define a threshold value to differentiate between exudative and transudative pleural effusion. Materials & Methods: A cross sectional study was done on 130 patients showing pleural effusion on CT thorax, mean attenuation was calculated using nine regions of interest on three slices. Within 48 hours of imaging, biochemical assessment was done to decide exudative or transudative nature of fluid as per Light’s criteria. A Receiver operating characteristic curve was drawn to assess the cut off CT attenuation value for distinguishing between exudative and transudative effusion and evaluate its accuracy. Result: Mean CT attenuation value of 57 exudative effusion cases was 5.9 + 6.48 HU, which was higher than 73 cases with transudative pleural effusion (2.97 + 2.69 HU). The difference was statistically significant (p value < 0.0001). The ROC curve revealed a cut off value of 7.5 HU. When the mean CT attenuation value was > 7.5 HU, the specificity and sensitivity of CT scan for diagnosing exudative effusion was 98.6 % and 59.6% respectively. Area under the curve was 0.79, which revealed moderate accuracy of this threshold value. Conclusion: CT attenuation values have moderate accuracy in differentiating between exudative and transudative pleural effusion.
The abnormal collection of fluid in pleural cavity is described as pleural effusion, which occurs due to imbalance between the secretion of fluid by parietal pleura and its absorption by the lymphatics. It can be classified into two main types- exudative and transudative. Exudative effusion is seen in pathologies causing increased permeability of vessels, including inflammation, malignancy, infection and thromboembolism. [1] On the contrary, transudative effusion results due to a disharmony between the hydrostatic and oncotic pressures in conditions like liver cirrhosis, congestive heart failure and nephrotic syndrome. [2]
The differentiation between exudative and transudative effusion is crucial both for diagnosis and clinical management of the patient. [3] Conventionally, this differentiation is achieved by biochemical analysis of pleural fluid obtained by thoracentesis.[4,5]
Being an invasive procedure, thoracentesis has potential iatrogenic risks of causing pneumothorax, haemothorax and minor complications like pain, hematoma formation and local site infection. Therefore, a non-invasive technique will not only avoid these potential complications but will also allow the differentiation, especially in cases where invasive thoracentesis is not possible, such as patients with bleeding diathesis and coagulopathy.
In the past, various attempts have been made for non-invasive characterisation of pleural effusion as exudative or transudative by using threshold of CT attenuation value, however there are no set uniform cut off values. The studies conducted previously revealed highly variable and conflicting data. The present study was done to assess the diagnostic efficacy of CT attenuation values in differentiating the exudative and transudative pleural effusion and to define a threshold CT attenuation value for this differentiation.
This prospective cross-sectional study was carried out between November 2017 and April 2019. A total of 130 subjects (85 male, 45 female) were included in the study and CT scan was performed. All patients who were referred to Department of Radiodiagnosis, VMMC & Safdarjung hospital for chest CT and found to have pleural effusion were included in the study. In patients showing pleural effusion on CT scan, ultrasound guided thoracentesis was done within 48 hours of the scan and biochemical analysis of the fluid was done for pleural fluid and serum protein and LDH levels. [6] Recent literature shows that pleural fluid obtained within 48 hours; especially in patients with CHF undergoing diuresis gives more accurate results when applying Light’s criteria. The effusion was characterised as exudative or transudative in accordance with the Light’s criteria, which states that if any 2 out of the following 3 criteria is met, then the fluid is exudative in nature-
• Pleural fluid total-protein-to serum-total-protein ratio > 0.5,
• Pleural fluid LDH-to-serum-LDH ratio > 0.6,
• Pleural fluid LDH > 2/3rdof the upper limit of normal serum LDH.
All patients who had undergone prior thoracentesis before the CT scan or having minimal untappable amount of pleural fluid (which could not be aspirated because of minimal quantity) or having hematoma associated with trauma were excluded from the study.
CT thorax examination was performed using a Multidetector computed tomography (MDCT) scanner. Acquisition parameters used in the study was as follows: 120 kV peak, automated MAs, slice thickness of 1-10 mm and pitch:1. The scans were acquired from the level of thoracic inlet extending up to the level of upper abdomen with arms extended overhead to reduce the beam hardening artifact.
A region of interest was placed by a single observer for measurement of attenuation values in the area of the largest amount of pleural effusion on each of the three slices used at anterior, middle and posterior part of effusion. The maximum amount of pleural effusion was determined by largest anteroposterior dimension of effusion. Attenuation values were measured at three sites (anterior, middle and posterior) on each of the three different slices (Figure 1). Hence, mean values were calculated using a total of 9 values taken in every patient. Other CT findings including pleural thickening, pleural nodules, extra-pleural fat pad thickness, pulmonary parenchymal pathology and fluid loculation were also recorded.
Statistical Package for Social Sciences (SPSS) version 21.0 was used for the statistical analysis. Categorical variables were given in number and percentage (%) and continuous variables were given as mean ± SD and median. Quantitative variables were compared using Mann-Whitney Test (as the data sets were not normally distributed) between the two groups. Receiver operating characteristic curve was drawn and utilized to find out cut off point (threshold value) of HU for predicting the type of effusion. Inter-rater kappa agreement was used to find out the strength of agreement between mean HU and pulmonary pathology with type of effusion. Diagnostic test was used to find out sensitivity, specificity, PPV and NPV. Whenever p value was <0.05, statistically significant outcome was considered.
The research protocol was approved by the institutional ethics committee of VMMC & Safdarjung Hospital, New Delhi (IEC/VMMC/SJH/S. No.185). The type, method and liabilities of the study procedure were explained to the subjects, and informed consent was obtained. All the data acquired was classified, and subjects had full ability to drop out from the study at any step. All principles of the Declaration of Helsinki were adhered to in the present study.
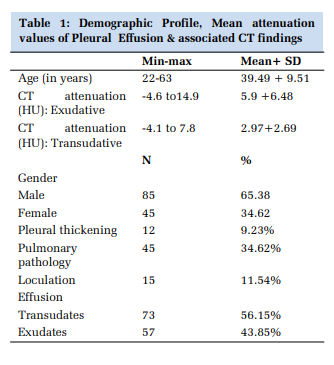
Among the study population of 130 subjects, there were 85 male and 35 female (age range 22-63 years; mean age 39.39±9.51 years). As per the Light’s criteria, 57 (43.85%) patients had exudative and 73 (56.15%) had transudative pleural effusion. Table 1 summarizes the demographic profile of study subjects, mean attenuation values of pleural effusions in Hounsfield units and associated CT findings.
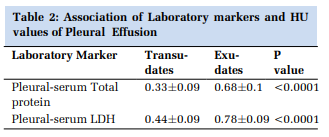
Mean CT attenuation value in subjects with exudative pleural effusion was 5.9 + 6.48 HU, whereas mean CT attenuation value in cases with transudative pleural effusion was 2.97 + 2.69 HU. The mean attenuation value in exudative pleural effusion was found to be higher than the mean attenuation in transudative effusion and the difference was statistically significant (p value <0.0001). The association of laboratory markers and HU values of pleural fluid are briefed in Table 2.
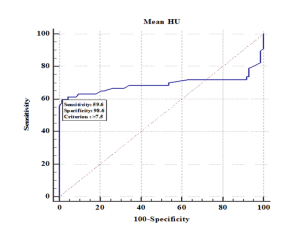
Based on this statistically significant difference in the mean attenuation values, a ROC curve was derived (Figure 2). The ROC curve revealed a cut off value of 7.5 HU for the differentiation of types pleural effusion i.e., when mean attenuation value was > 7.5 HU, exudative effusion can be diagnosed with a specificity of 98.6 % and sensitivity 59.6% respectively. Area under the curve (Az) was 0.79 with moderate accuracy. At a cut off value of 3.4 HU, the specificity was 50.68% and the sensitivity was 68.42% for diagnosis of exudative effusion.
The positive predictive value (PPV) of mean attenuation value was 97.14 % and the negative predictive value (NPV) was 75.79 %. The present study results were almost similar to previous studies reported in literature, with slightly lower sensitivity (59.6 %) and higher specificity in distinguishing the types of pleural effusion with CT attenuation values.
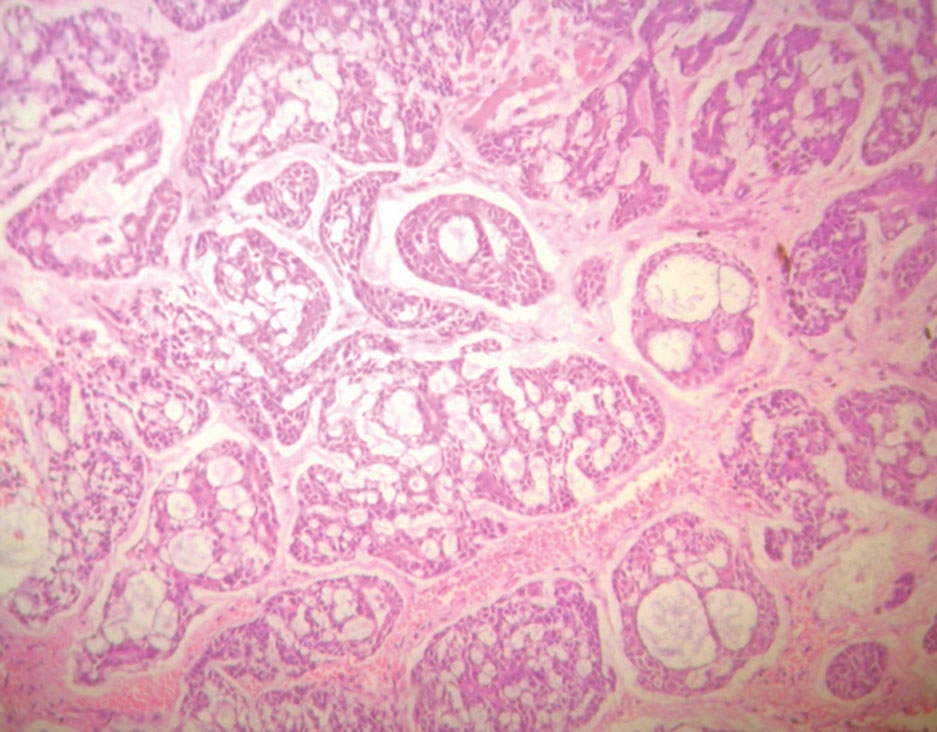
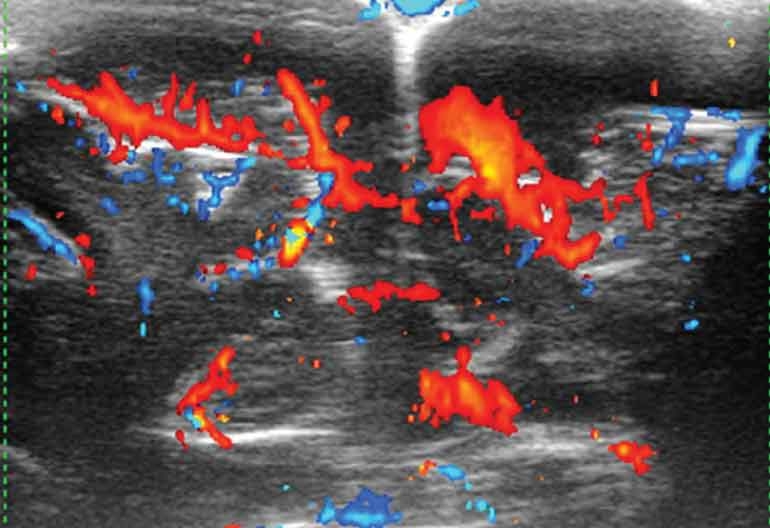
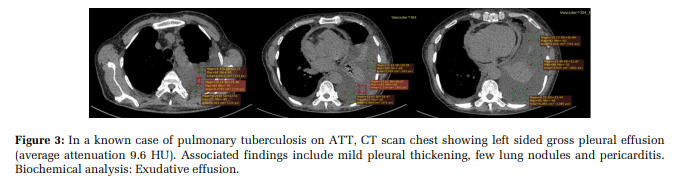
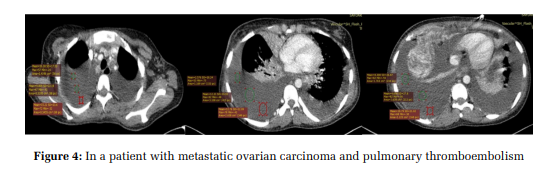
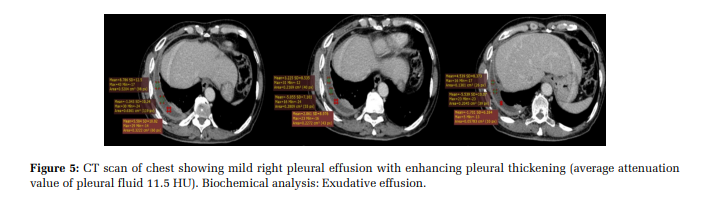
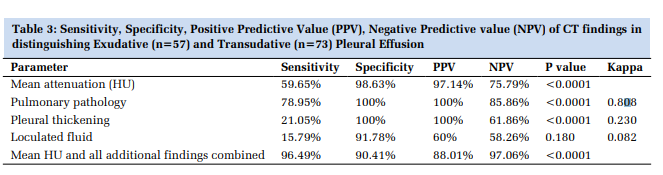
The addition of other CT findings like pulmonary pathology, pleural thickening, nodules and loculated fluid (Figures 3 and 4 & Figure 5) improved the diagnostic accuracy for the differentiation of exudative and transudative pleural effusion which is elaborated in Table 3.
CT scan chest reveals bilateral pleural effusion (right > left) with mean attenuation value 10.3 HU. Collapse consolidation of the adjacent lung with multiple pleural metastatic deposits and acute pulmonary thrombosis is also seen. Biochemical analysis: exudative effusion.
Loculation was seen in 4.62% of transudates and 6.92% of exudates with insignificant association (p value 0.180). Pulmonary pathology was found in none of the transudates and 34.62% of exudates. None of the transudates showed pleural thickening as compared to 9.23% of exudates. Both pulmonary pathology and pleural thickening showed significant association with types of pleural effusion (p value <0.0001).
Pleural cavity, the space between parietal and visceral pleura normally contains 7-14 ml of fluid. [7] This fluid functions to reduce friction between these layers during respiration. Normally, the pleural fluid amount is maintained by the equilibrium between secretion and drainage of fluid by parietal pleura in a healthy person. If this equilibrium gets disturbed, either by increased secretion or by decreased drainage, abnormal collection of fluid develops, resulting in pleural effusion. Pleural effusion is an extremely commonly encountered condition in clinical practice with a prevalence of 320 cases per 1 lakh population per year.[8,9] The nature of pleural effusion, whether exudative or transudative is crucial in the management of patient and deciding the further plan of action in the treatment of the case.[7–9] Usually, the clinical history and examination provides some insight into the possible cause and nature of pleural effusion.[2,3] However, in most of the cases pleural tap or thoracentesis, which is an invasive procedure has to be done for confirmation, which again carries its own risks such as pneumothorax and contraindications like coagulopathy. Despite of numerous studies done across the globe to evaluate the utility of CT attenuation values in predicting the nature of pleural effusion, no consensus has been reached on a set threshold or numeric cut off value with good accuracy.[10–14]
The present study revealed statistically significant difference was found between mean attenuation of transudative pleural effusion (2.97+2.69 HU) and the mean attenuation of exudative (5.9 + 6.48 HU) pleural effusion. Also, the exudative pleural effusion showed high levels of protein and LDH, consistent with Light’s criteria with statistically significant results.
These findings were concordant with almost all the studies done previously. Nandalur et al. ascertained that mean attenuation in exudative effusion (17.1 + 4.4 HU) was significantly higher than mean attenuation in transudative effusion (12.5 + 6.3 HU) but this association had a moderate accuracy (Az= 0.775) due to considerable overlap in the attenuation values of exudative and transudative effusion cases. [10]
Cullu et al. too found higher mean attenuation values in patients with exudative pleural effusion than those with transudative pleural effusion. [11] Rashid et al. observed that exudative effusion had higher mean attenuation values (8.1 + 5.69 HU) with respect to transudative effusion (3.53 + 4.23 HU). [12] Similarly, Kadihan et al reiterated this fact in their study and found that mean attenuation in exudative effusion was 8.82 +7.04 HU, which was greater than the mean attenuation of transudative effusion (2.91 + 8.53 HU) and the difference was statistically significant. [13]
Furthermore, Bandaru et al. also found that mean attenuation in exudative effusion (14.65 + 6.07 HU) was significantly higher than that of transudative pleural effusion (4.66 + 2.29 HU). [14]Sekhon et al. observed higher attenuation in exudative effusion (12.4 HU as compared to 9.6 HU in transudative effusion) but their finding was not statistically significant. [15] Small sample size of just twenty subjects may be the possible reason for such result. Our results were in conflict with the peculiar results obtained by Abramowitz et al. in their study. They found that the mean attenuation of exudative effusion (7.2 + 9.4 HU) was paradoxically lower than the mean attenuation of transudative effusion (10.1 + 6.9 HU). [7] However, their observation was not statistically significant.
The maximum value of mean attenuation we observed in exudative effusion was 14.9 HU and minimum value was -4.6 HU. The range of mean attenuation in transudative pleural effusion cases was from -4.1 to 7.8 HU. Negative values of attenuation were also observed in both exudative as well transudative pleural effusion cases in studies conducted by Rashid et al. and Abramowitz et al. They postulated that due to the lysis and inflammation of cells, there is leakage of cholesterol and fat into the pleural fluid that is more often seen in exudative effusion and can possibly lead to negative attenuation values of pleural effusion.[7,12] In the present study, a ROC (Receiver Operator Curve) was derived, to obtain sensitivity and specificity at various attenuation values to decide a cut off value for differentiating transudative and exudative type of pleural effusion. At a cut off of 7.5 HU, a specificity of 98.6 % and a sensitivity of 59.6 % was achieved. At a cut off value of 3.4 HU the specificity and sensitivity were 50.68 % and 68.42 % respectively.
Almost all the previous studies in the literature obtained considerably similar results. Nandalur et al. concluded that at a cut off of 13.4 HU, the differentiation can be done with a sensitivity of 83.2 % and specificity of 70.5 %. [10] Cullu et al. proposed a cut off value of 15 HU, beyond which exudative pleural effusion can be considered but with moderate accuracy only (AUC, 0.775; 95% CI, 0.699–0.851). [11] Rashid et al. proposed a cut off value of 4.5 HU, and revealed that exudative effusion can be suspected beyond this value with a specificity and sensitivity of 62.5 % and 74.46 % respectively. [12]Bandaru et al. gave the cut off value of 8 HU in their study which had 91.6 % sensitivity and 82.7 % specificity in distinguishing the two types of pleural effusion. [14] Abramowitz et al. noticed that with < 8.5 HU, surprisingly exudative effusion can be anticipated but with very poor sensitivity and specificity (55.1 % and 68.2 % respectively). [7]
Apart from the mean attenuation values of pleural fluid, we also additionally read the CT images for presence of any pulmonary pathology like consolidation, pleural thickening, pulmonary nodules or any loculated fluid collection. All of these findings were more frequently seen in exudative type of pleural effusion with respect to transudative pleural effusion. In the present study, pulmonary pathology, pleural thickening and pulmonary nodules were found to be highly specific for exudative pleural effusion with variable sensitivity (100 % specificity for all three parameters and 78.95 %, 21.05 % and 59.65% sensitivity respectively). Loculated pleural fluid collection was found have good specificity of 91.78% but poor sensitivity of just 15.79% in distinguishing exudative and transudative type of pleural effusion.
These findings were concordant and consistent with the study done by. Aquino et al. who observed that pleural thickening was 96 % specific in diagnosing exudative nature of pleural effusion. [16]Similarly, Rashid et al. observed that fluid loculation and pleural thickening were seen in 91.4 % and 50.9% cases of exudative effusion as compared to only 64.3 % and 19.5 % cases of transudative pleural effusion. [12]Bandaru et al. also observed the higher association of pleural thickening, nodules and loculation in exudative effusion cases with specificity of 91.6 %, 95.8 % and 100 % respectively. [14]A comparison of key features of present study and previous literature has been illustrated in Table 4.
On the contrary, Abramowitz et al. found that fluid loculation, pleural thickening, nodules were more commonly seen in exudative effusion but they were insignificantly associated with exudative type of pleural effusion. [7] Kadihan et al. also found no statistical difference in pleural thickness, fluid loculation or nodules in these two types of pleural effusion. [13]
The present study; however, has certain limitations. First, IV contrast was administered to few patients while not to others. Although, there were no discernible gap in measurements in the mean attenuation values, still further studies with a standard technique and protocol, preferably non-contrast to reduce volume averaging, will improve the results. Also, we excluded patients with hemothorax or chylothorax. Moreover, there was a bias for larger effusions because usually smaller effusions do not undergo thoracocentesis. Larger sample size with population and protocol-based cut-off values would definitely lead to improved results and help reduce the iatrogenic complications by avoiding the need for thoracocentesis.
In the present study, the diagnostic accuracy of CT attenuation value in differentiating types of pleural effusion mirrors those depicted in earlier studies albeit a slightly higher specificity and lower sensitivity. However, due to excessive overlap in the attenuation values of the two types of pleural effusion, use of only CT attenuation value is not completely reliable. However, this should not demoralize the physicians from using this primary modality in patients with pleural effusion. Not only CT helps with diagnosis, it also can guide the exact positioning of chest tubes, as and when required. Addition of other findings like pulmonary pathology, pleural thickening, nodules and loculated pleural fluid improve the diagnostic accuracy but biochemical analysis of pleural fluid still, continues to be the gold standard.
There are no conflicts of interest
This research received no specific grant from any funding agency in the public, commercial or not-forprofit sectors.
The data that support the findings of this study are available from the corresponding author, upon reasonable request.
We would like to thank the staff of Department of Radiodiagnosis and Department of Biochemistry.


Subscribe now for latest articles and news.