Journal of Medical Sciences and Health
Year: 2022, Volume: 8, Issue: 3, Pages: 258-263
Original Article
Shahul Hameed1 , Afsha Shaheen S Hullur2 , K Chethana1 , Asif Khan3 , K G Kiran4
1Associate Professor, Department of Community Medicine, Kanachur Institute of Medical Sciences, Mangaluru, Karnataka, India,
2Undergraduate Medical Student,, Kanachur Institute of Medical Sciences, Mangaluru, Karnataka, India,
3Professor, Department of Community Medicine, Kanachur Institute of Medical Sciences, Mangaluru, Karnataka, India,
4Professor, Department of Community Medicine, Kanachur Institute of Medical Sciences, Mangaluru, Karnataka, India
Address for correspondence:
Asif Khan, Professor, Department of Community Medicine, Kanachur Institute of Medical Sciences, Mangaluru, Karnataka, India.
E-mail: [email protected]
Received Date:18 January 2022, Accepted Date:28 September 2022, Published Date:03 December 2022
Introduction : In elderly individuals, morbidity has a substantial impact on the physical and psychological well-being. Quality of life in elderly may be affected by the morbidities that they suffer. Material and Methods: A community-based cross-sectional study was conducted from September to November 2021 in the rural areas attached to the Rural Health Training Centre of a teaching hospital. Elderly individuals were selected by multistage sampling. The sample size was estimated as 118. Participants’ data was collected using a pretested semi-structured questionnaire regarding their socio-demographic profile and morbidity status. Quality of life (QOL) was assessed by using the WHOQOL-BREF scale. The difference between mean scores in the domains was tested by using an independent sample t-test. Statistical significance was set at 5% level of significance (p < 0.05). Results: Majority (57.6%) of the study population were males, 57.6% were illiterate and only 9.3% lived in joint families. Major morbidities reported were hypertension (55.9%), impaired vision (52.5%) and joint pain or stiffness (50.8%). The mean perceived overall quality of life scores in the study population were 61.9±17.5. Male participants had higher mean social and environmental domain scores. Literate individuals had higher social domain mean scores which was statistically significant. Conclusion: Appropriate rehabilitation measures along with health education with the assistance of a geriatric psychologist in order to identify gaps in QOL domains and approaches to solve them would help to improve the quality of life of the elderly.
Keywords: Morbidity, Elderly, Quality of life, Rural
Ageing is an inescapable biological phenomenon. It's connected to a higher risk of disease, disability, diminished functional capacity and ultimately, death. 1 According to the Government of India, everyone who is 60 years or over is considered as elderly. 2 The elderly population is growing at an unprecedented rate. Globally, there were approximately 1 billion individuals aged 60 and more in 2019, which is expected to rise to 1.4 billion by 2030 and 2.1 billion by 2050 as per World Health Organization. 3 Because it symbolizes their health and well-being, the elderly's quality of life (QOL) is a major subject of concern on a global scale. This is still a neglected issue in poorer countries like India. 4
India has around 104 million elderly persons, according to the 2011 Census. This number is expected to climb to 173 million by 2026. 5 The elderly population has increased from 5.6 percent in 1961 to 8.6 percent in 2011, with the majority (71%) residing in rural areas. 6 The health of an elderly population is a major concern that already has a significant impact on their quality of life. 7 Morbidity has a substantial impact on the physical and psychological well-being of the aged. The elderly are affected by a variety of chronic diseases. Chronic illnesses have an initial impact on them, leading to disability. 8
The WHO defines quality of life as an individual's perceptions of their living situations in relation to their objectives, aspirations, standards, and concerns in the context of their culture and value systems. Health-related quality of life (HRQOL) was established to measure the effects of health on QOL from a clinical medicine and health-care outlook. 9
Hence, this study was undertaken to assess the morbidity pattern and HRQOL among the elderly in the rural areas of Mangaluru, in coastal Karnataka, India
A community-based, cross-sectional study was conducted from September to November 2021 in the rural areas attached to the Rural Health Training Centre (RHTC) of a teaching hospital. Individuals above 60 years of age residing in those areas were selected by multistage sampling. Out of the four areas attached to the RHTC, two areas among them were selected. In the areas selected, the number of subjects was selected by population proportion to size. The study subjects in each area were selected by simple random technique from the family folder maintained at RHTC. Considering the expected Standard Deviation (SD/ ϭ) of the QOL score in the elderly population as 16.4 from a previous study 10 and precision(d) as 3 at 95% confidence interval, the sample size was estimated as 118 using the formula n=(Zα/2)2 ϭ2/d2.
The study began after receiving approval from the Institutional Ethics Committee. Selected participants provided written consent to participate in the study, and data was collected using a pretested semi-structured questionnaire that included questions about socio-demographic profile, personal habits, and morbidity status. Morbidity status was assessed based on a certified medical practitioner's existing diagnosis as well as a physical examination by the investigator.
The WHOQOL-BREF scale was used to assess quality of life (QOL). 11 With a total of 26 questions, this instrument covers four domains: physical health, psychological, social interactions, and the environment. On a 5-point Likert scale, each of these domains was scored. According to the World Health Organization, each domain's raw scores were determined by aggregating the values of single items and then translated into a score ranging from 0 to 100, with 100 being the highest and 0 being the lowest value. Each domain's mean score, total score, and average score were determined. Further, the data was entered into a Microsoft Excel 2010 spreadsheet and analyzed using SPSS 18 (Statistical Package for Social Sciences). Data was represented using proportions and percentages. The difference between mean scores was tested by using an independent sample t-test. Statistical significance was set at 5% level of significance (p < 0.05).
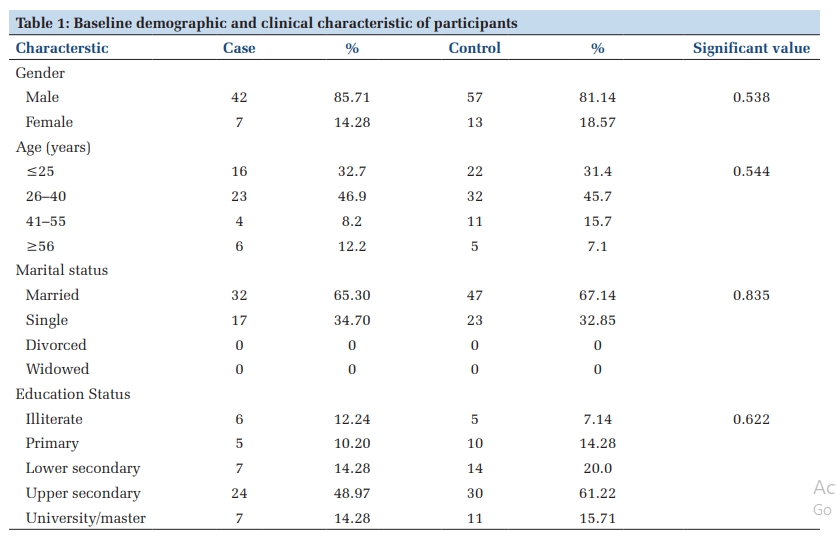
Majority of the study population were in the age group of 60-64 years (45.8%) which is followed by 65-69years (28%). Least belonged to 80 years and above (1.7%). Majority of the study population comprised of Hindus (57.6%) and 57.6% were males. Among them, 81.4% of the study population were married and were living with their spouses and 18.6% were either widowed or divorced. Among the study population, 57.6% were found to be illiterate and 1.7% had education till PUC or above. They lived predominantly in nuclear families (90.7%) as compared to 9.3% who belonged to joint/three generation families. Among the study population, 35.6% were employed, 58.5% were BPL ration cards holders and only 18.6% received old age pension. About 39.8% of the study population used tobacco, among which 21.2% smoked beedi/cigarette and 18.6% used tobacco as snuff/chewing tobacco/khaini. 19.5% of the elderly also consumed alcohol (Table 1).
|
Characteristic |
Number |
Percentage |
|
|
Age (years) |
60-64 |
54 |
45.8 |
|
65-69 |
33 |
28.0 |
|
|
70-74 |
21 |
17.8 |
|
|
75-79 |
8 |
6.8 |
|
|
80 and above |
2 |
1.6 |
|
|
Gender |
Male |
68 |
57.6 |
|
Female |
50 |
42.4 |
|
|
Religion |
Hindu |
68 |
57.6 |
|
Muslim |
33 |
28.0 |
|
|
Christian |
17 |
14.4 |
|
|
Marital status
|
Married |
96 |
81.4 |
|
Single |
22 |
18.6 |
|
|
Education status |
Illiterate |
68 |
57.6 |
|
Primary school |
29 |
24.6 |
|
|
Middle school |
12 |
10.2 |
|
|
Secondary school |
7 |
5.9 |
|
|
Pre-university and above |
2 |
1.7 |
|
|
Type of family |
Nuclear |
107 |
90.7 |
|
Joint/ Three generation |
11 |
9.3 |
|
|
Employment status |
Yes |
42 |
35.6 |
|
No |
76 |
64.4 |
|
|
Ration card |
BPL card |
69 |
58.5 |
|
APL card |
49 |
41.5 |
|
|
Getting old age pension |
Yes |
22 |
18.6 |
|
No |
96 |
81.4 |
|
|
Tobacco Use |
No |
71 |
60.2 |
|
Smoked |
25 |
21.2 |
|
|
Smokeless |
22 |
18.6 |
|
|
Alcohol consumption |
Yes |
23 |
19.5 |
|
No |
95 |
80.5 |
|
Among the study population major morbidities were hypertension (55.9%), impaired vision (52.5%) and joint pain or stiffness (50.8%). Among male subjects, hypertension was the major morbidity followed by impaired vision, joint problems, respiratory and gastrointestinal problems. Elderly females had joint problems as their major morbidity, followed by impaired vision, hypertension, anemia and obesity (Figure 1).

The mean perceived overall quality of life scores in the study population were 61.9±17.5 and the mean perceived overall health status scores were 61.4±17.2. Figure 2 shows the distribution of different domains of quality of life. It was observed that, 45.7% of the study population perceived poor to moderate quality of life and about 54.2% of the population perceived good to very good quality of life in physical domain. Under the psychological domain quality of life in 51.7% was found to be poor to moderate and 48.3% had good to very good quality of life. With respect to the social domain majority (40.7%) have a moderate quality of life and 32.2% have good to very good quality of life. Majority (28.8%) have a moderate quality of life followed by poor quality of life (27.1%) in environmental domain.

Mean quality of life among different domains were observed (Table 2). Male participants had higher mean social and environmental domain scores, with mean social domain scores showing a statistical significant difference. Among those who were literate the social domain mean scores were higher than compared to those who were illiterate and this difference was statistically significant. Individuals who were employed had statistically significant higher physical domain mean scores as compared to those who were unemployed. Those who were married and lived in joint families had higher mean scores in all the domains; however, there was no statistical significance in them.
|
Variables |
Physical domain |
Psychological domain |
Social domain |
Environmental domain |
|
|
Mean±SD |
Mean±SD |
Mean±SD |
Mean±SD |
||
|
Gender |
Male (n= 68) |
63.4±12.3 |
58.7±12.3 |
61.1*±12.2 |
61.2±12.2 |
|
Female (n= 50) |
65.8±11.4 |
59.5±9.9 |
60.3±11.9 |
60.3±11.9 |
|
|
Test value (p value) |
1.021 (0.633) |
0.392 (0.696) |
-2.45 (0.016) |
-0.380 (0.571) |
|
|
Age group (years) |
60-69 (n=104) |
64.7±12.2 |
58.9±11.3 |
62.7±12.6 |
60.5±12.5 |
|
70 & above (n=14) |
62.5±10.3 |
60.1±11.2 |
62.5±10.7 |
63.2±8.1 |
|
|
Test value (p value) |
0.635 (0.539) |
-0.380 (0.908) |
0.045 (0.402) |
-0.782 (0.06) |
|
|
Education |
Illiterate (n=68) |
65±10.9 |
57.7±10.5 |
60.1±14.2 |
59±11.3 |
|
Literate (n=50) |
63.6±13.3 |
60.8±12.1 |
66.0*±8.4 |
63.3±12.6 |
|
|
Test value (p value) |
0.651 (0.227) |
-1.490 (0.120) |
-2.79 (0.006) |
-1.965 (0.571) |
|
|
Employment status |
Unemployed (n=76) |
63.1±12.9 |
59.2±11.2 |
62.8±12.6 |
61.8±11.5 |
|
Employed (n=42) |
66.8*±9.5 |
58.7±11.6 |
62.3±12.0 |
59±12.8 |
|
|
Test value (p value) |
-1.598 (0.049) |
0.221 (0.633) |
0.221 (0.985) |
1.212 (0.136) |
|
|
Marital status |
Married ( n= 96) |
64.5±12 |
59.2±11.4 |
64±11.7 |
61.1±12.1 |
|
Alone (n= 22) |
64.1±12 |
58.3±10.8 |
56.8±13.8 |
59.4±11.8 |
|
|
Test value (p value) |
0.123 (0.489) |
0.324 (0.406) |
2.504 (0.432) |
0.617 (0.737) |
|
|
Type of family |
Nuclear (n=107) |
64.1±12 |
58.7±11.2 |
61.8±12.3 |
60.2±12.3 |
|
Joint (n=11) |
67.9±11.8 |
62.1±11.9 |
70.5±10.1 |
66.8±7.7 |
|
|
Test value (p value) |
-1.007 (0.352) |
-0.952 (0.859) |
-2.239 (0.18) |
-1.655 (0.103) |
|
Test statistics used independent sample t test. SD- Standard Deviation * Independent sample t test showed p<0.05
One or more morbidities were reported by more than 60% of the participants in this study. Different countries of the world have reported dissimilar rates of morbidity among the elderly. According to a study conducted in Mangalore, older people had a morbidity rate of 94.2 percent. 12 A total of 46.2 percent of persons in Tamil Nadu self-reported morbidity. 13 Morbidity has a significant impact on the psychological aspect of quality of life. As a result, if a person has more than one morbidity, his or her quality-of-life declines.
According to self-reported morbidity, hypertension and diabetes mellitus were the most common health problems among study subjects. These results are similar to those reported in studies done by Gomati et al in Tamil Nadu 13 and by Ganesh K in Puducherry. 14 Similar findings were also found in a Saudi Arabian study 15 Chronic diseases play an influence in the physical and psychological areas of quality of life, according to Joshi et al 16, and this was confirmed in our study.
In the present study mean overall quality of life was found to be 61.9±17.5. The physical and social domains had the highest mean score among the domains, which was similar to a study conducted in Gujarat by Shah et al. 17 In our study, the mean QOL score in the psychological domain was similar to that of Gomathy et al. 13 and Ganesh K et al. 14, however there were significant disparities in the mean QOL score in the environmental domain. The inequalities identified in numerous studies could be explained by differences in the ecology of distinct regions. Another factor that could be contributing to the variance is the definition and methodology used to measure QOL.
Males and females, as well as literates and illiterates, showed statistically significant differences in the social domain. Shah et al. 17 found similar results in their research. The study participants who were married and raised their children in a joint family had a high quality of life in all areas. This finding was similar to a study conducted in both India and Pakistan, which indicated that those who lived in joint families had a higher quality of life than those who lived in nuclear families. 18, 19
This study looked at the elderly's health-related quality of life and morbidity patterns. The main morbidities were hypertension, decreased eyesight, and joint discomfort or stiffness. Males, those who were literate, married, and those who lived in joint households had a higher quality of life. An aged person's morbidity status can have a significant impact on both physical and psychological well-being. Programs that include suitable rehabilitative treatments and the delivery of health education with the help of a geriatric psychologist to identify gaps in QOL domains and techniques to solving them would help to improve quality of life and so allow for a healthy ageing process.
We would like to acknowledge the funding of this research by Rajiv Gandhi University of Health Sciences-Undergraduate Research Grant. We would like to thank the Dean of the Institution for his encouragement and support. We would also like to thank all participants of this study.
None
Subscribe now for latest articles and news.