Journal of Medical Sciences and Health
DOI: 10.46347/jmsh.2019.v05i03.003
Year: 2019, Volume: 5, Issue: 3, Pages: 13-18
Original Article
Sumana J Kamath1, Madhurima K Nayak2
1Former Professor, Department of Ophthalmology, Kasturba Medical College, Mangaluru, Karnataka, India,
2Consultant, Department of Ophthalmology, Yenepoya Specialty Hospital, Kodialbail, Mangaluru, Karnataka, India
Address for correspondence:
Dr. Madhurima K Nayak, Consultant, Department of Ophthalmology, Yenepoya Specialty Hospital, Kodialbail, Mangaluru, Karnataka, India. Phone: +91-9880530507. E-mail: [email protected]
Objective: Accurate measurement of intraocular pressure (IOP) is an integral part of glaucoma diagnosis and management. IOP measurement is influenced by central corneal thickness (CCT). Aims: This study aims to compare the CCT as measured by spectral-domain (SD) optical coherence tomography (OCT) in glaucomatous and non-glaucomatous eyes and to compare the CCT in various types of glaucoma.
Settings and Design: It was a prospective case–control study conducted at a tertiary hospital in Mangaluru.
Materials and Methods: Patients diagnosed with primary open-angle glaucoma (POAG), normal-tension glaucoma (NTG), and ocular hypertension (OHT) were taken as cases. They underwent CCT measurement using SD-OCT anterior segment cube program after a complete ophthalmic evaluation.
Statistical Analysis: Data were analyzed using SPSS for Windows, version 8.0 using Kruskal–Wallis test, Mann–Whitney U-test, and Chi-square test. P < 0.05 was considered statistically significant.
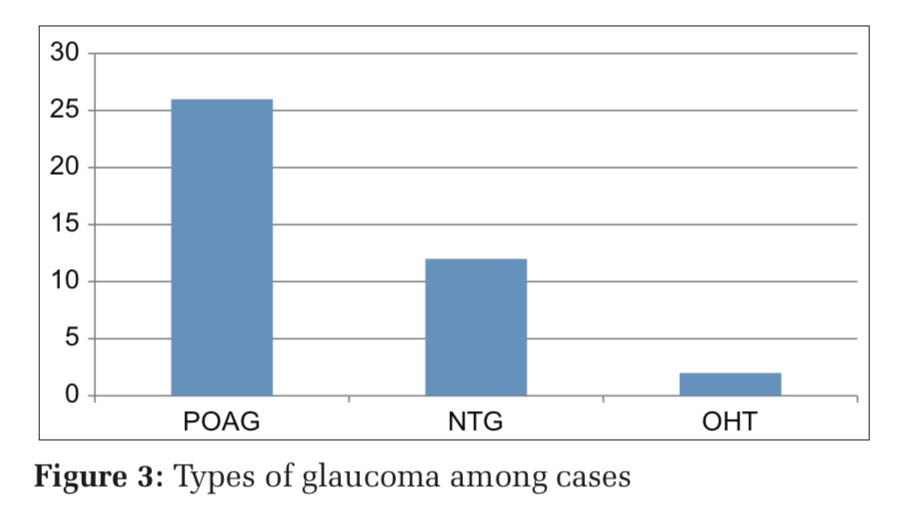
Results: Forty cases (80 eyes) were included in the study, of which 26 had POAG, 12 had NTG, and 2 had OHT. Controls were 80 patients with healthy corneas. The mean CCT in POAG group was 518.69 μm, in NTG was 503.33 μm, and in OHT group 542.5 μm. The mean CCT among controls was 523.97 μm. The differences in CCT in all the four groups were statistically insignificant. The IOP was corrected for CCT and the difference between the two was statistically significant.
Conclusions: CCT is higher in OHT and lower in NTG. Our study did not find any statistically significant difference between the three types of open-angle glaucoma.
KEY WORDS: Cornea, glaucoma, low-tension glaucoma, ocular hypertension, open-angle, optical coherence, tomography.
Risk factors for glaucoma include elevated intraocular pressure (IOP), heredity, myopia, and race. Even though there are other factors involved in glaucoma progression, IOP is the only one that can be controlled. Thus, the measurement of accurate IOP forms the core of diagnosis and follow-up of glaucoma patients. It is important, therefore, to ensure meticulous IOP recording. Goldmann applanation tonometry is the best available method for the same. It was found that corneas thinner by 0.45 mm produced an underestimation of IOP by up to 4.7 mmHg, whereas corneas which were thick by 0.59 mm caused the observe to overestimate IOP by 5.2 mmHg when the actual IOP is 20 mmHg.[1] Thus, in eyes with thicker cornea, IOP is falsely recorded as high and in eyes with thinner corneas, IOP is falsely recorded as low.
Central corneal thickness (CCT) becomes an important parameter to be measured while deciding on target IOP in the treatment of glaucoma. In a study, significant adjustments were required in 55.9% of subjects based on which alterations in glaucoma therapy were planned. Thus, it was concluded that CCT has a significant impact on the clinical management of patients with glaucoma and glaucoma suspects.[2] Furthermore, it has been proven multiple times that patients with normal-tension glaucoma (NTG) have thinner corneas than normal and eyes with ocular hypertension (OHT) have thicker corneas than healthy individuals.[3-5] Our study aims to compare the CCT in various types of open-angle glaucoma with non-glaucomatous eyes with anterior segment (AS) setting of spectral-domain (SD) optical coherence tomography (OCT) and also to study the effect of CCT on the measurement of IOP when measured using Goldman applanation tonometer.
This was a prospective case–control study conducted in a tertiary hospital in Mangaluru, a coastal town in South Karnataka, in the period of January 2011–August 2014. Forty cases and 80 controls (80% power) were included in the study. Patients were grouped as follows:
Exclusion criteria included corneal infections, dystrophies, ectatic conditions, secondary glaucoma, angle-closure glaucoma, on drugs altering IOP (corticosteroids, monoamine oxidase inhibitors, antiparkinsonism drugs, and antipsychotics), pseudophakics and post-keratoplasty patients, recent contact lens wear, and any ocular trauma.
Patients were included in the study after a written informed consent and Institutional Ethics Committee approval. After complete glaucoma workup, they were labeled as POAG, NTG, or OHT. CCT measurement using AS cube program of SD-OCT was done. Eyes with healthy cornea above the age of 18 years were taken as controls after excluding the above-mentioned exclusion criteria. CCT was measured using AS cube program of SD-OCT. Data collection was done after taking a written informed consent using a pro forma. Sampling is done by non- random convenient sampling. Data analysis was done using SPSS for Windows, version 8.0 using Kruskal–Wallis test, Mann–Whitney U-test, and Chi- square test. P < 0.05 was considered statistically significant.
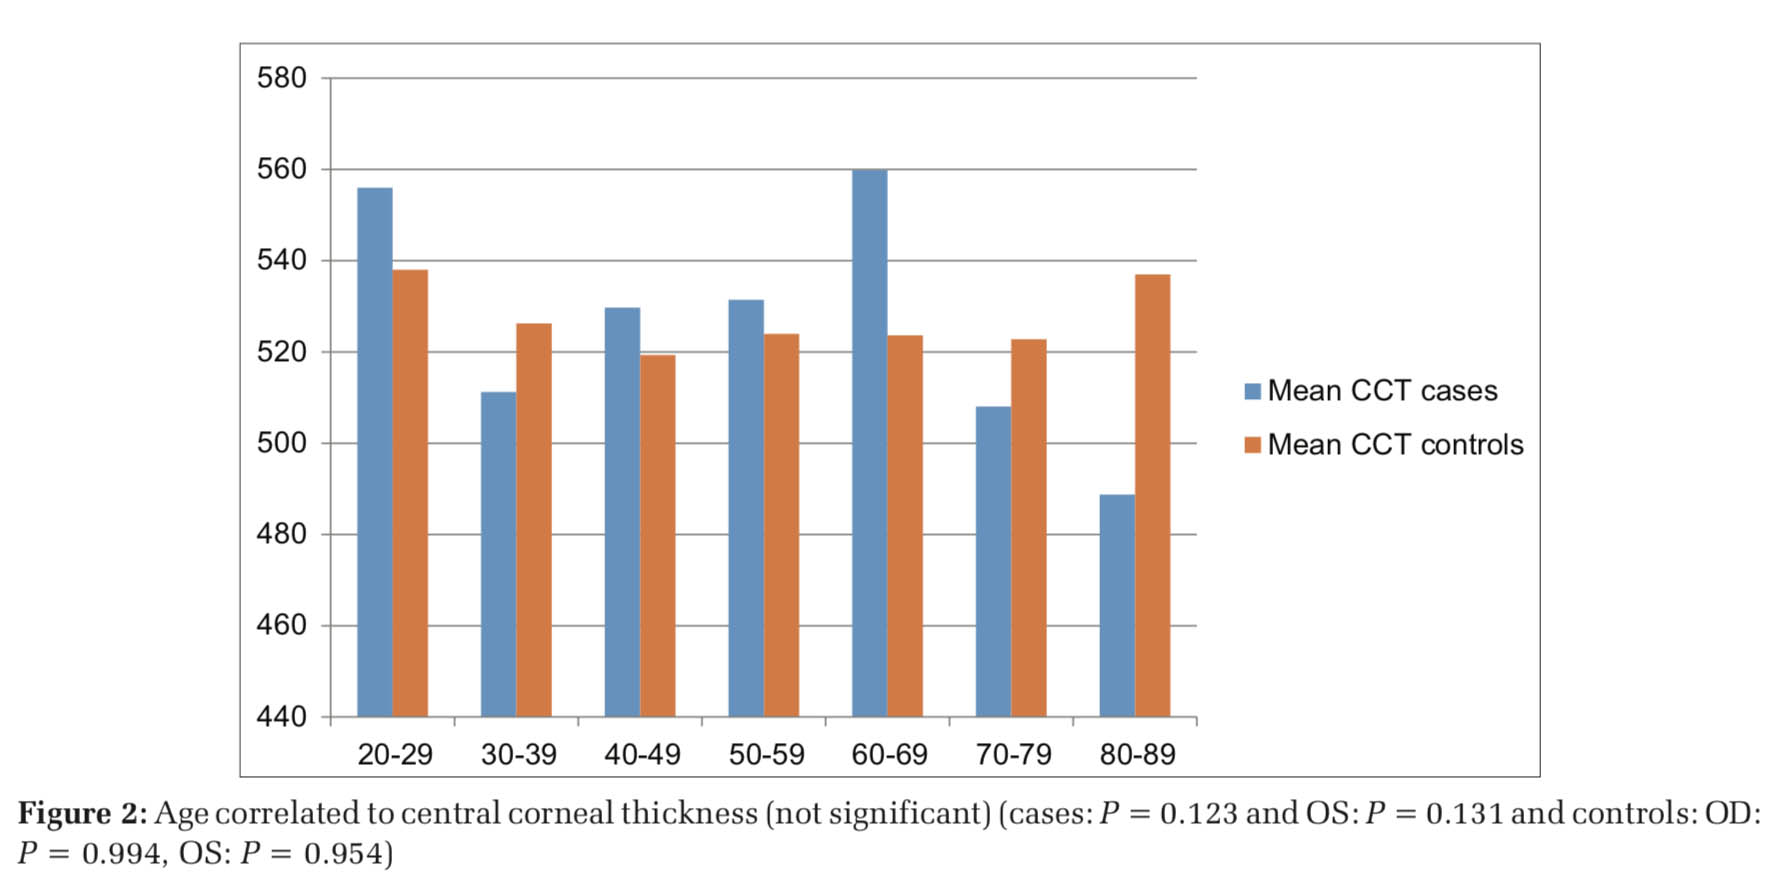
The mean age among the cases and controls was 60.23 years and 56.05 years, respectively. The age distribution is depicted in Figure 1. CCT was found to decrease after the seventh decade among the cases but no such decrease found among controls (Figure 2). Among cases, 55% were male and 45% were female; and among controls, 48.2% were male and 51.8% were female. The mean CCT in males was 519.57 μm and in females was 522.37 μm (not statistically significant).
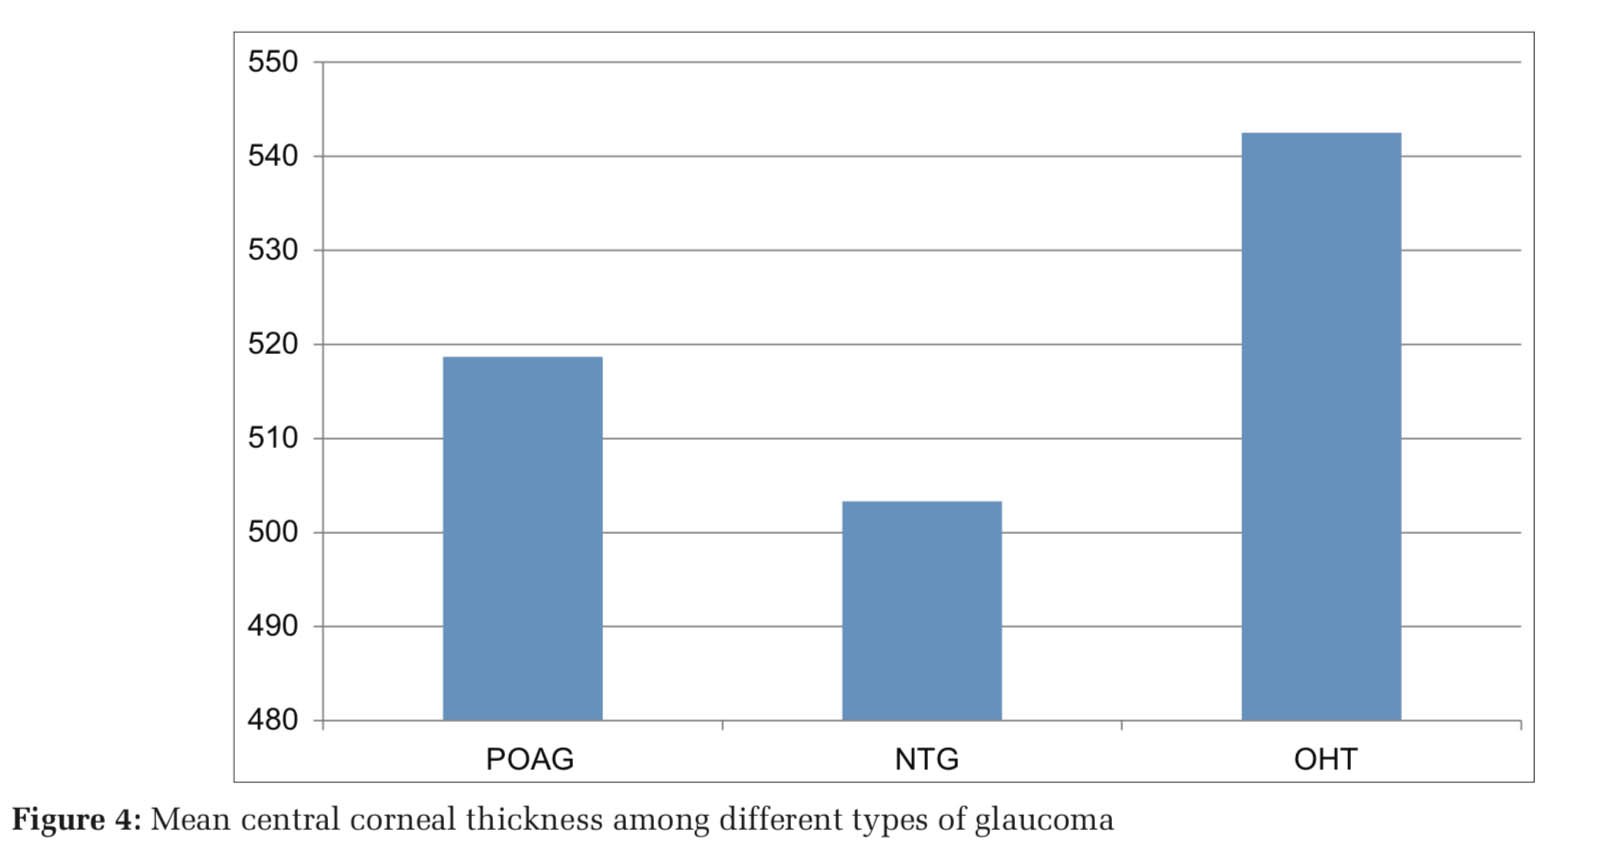
The groupwise distribution of cases was 26 – POAG, 12 – NTG, and 2 – OHT. Their distribution is depicted in Figure 3. IOP in both eyes was compared among the three groups and was found to have statistical significance [OD (right eye): P = 0.004 high significance; OS (left eye): < 0.001 very high significance]. Mean IOP in the POAG group was 20.8 mmHg (OD) and 22.54 mmHg (OS), in NTG group was 15.08 mmHg (OD) and 14.42 mmHg (OS), and in OHT was 21.50 mmHg (OD) and 25 mmHg (OS). Mean CCT in both eyes was lesser among the cases (OD: 514.13 μm and OS: 516.43 μm) than controls (OD: 525.18 μm and OS: 522.76 μm), but no statistically significant difference was found (P = 0.085 and 0.309). Mean CCT in POAG was 517.73 μm (OD) and 519.65 μm (OS), in NTG was 501.92 μm (OD) and 504.75 μm (OS), and in OHT was 537 μm (OD) and 555 μm (OS). The differences among the groups were statistically insignificant (OD: P = 0.151 and OS: P = 0.214) (Figure 4).
The IOPs measured in the three groups were corrected based on the correlation between pachymetry and CCT[3,6] and the corrected IOPs in various groups are shown in Table 1. The differences were very highly significant (P < 0.001). After correcting IOP, three patients who were initially diagnosed as NTG were reclassified as POAG.
Prostaglandins were the most commonly used medications. There was no statistically significant difference between the CCT in eyes on different medications, however, CCT in patients using prostaglandin analogs was thinner (Table 2). About 17.5% of the cases were diabetics, whereas 16.5% among controls were diabetics. CCT was significantly higher in diabetics among controls (P < 0.05), whereas CCT was lesser among diabetics and showed no clinical significance (Table 3).
We compared CCT as measured by SD-OCT in glaucomatous and non-glaucomatous eyes. The previous studies have shown a great correlation between CCT as measured by ultrasound pachymetry and OCT;[7] however, a difference of 26 μm was found between ultrasound pachymeter and AS-OCT by some.[5] Another study found a correlation factor of 32 μm to be added onto OCT measurements when compared to pachymetry and Orbscan.[6]
Patients with a prior history of ocular surgery were excluded from the study as CCT increases following surgery. It returns to pre-operative levels after around 1week following surgery.[7] Furthermore, contact lens users were excluded from the study as it causes corneal thinning and steepening due to its effect on corneal metabolism.[8]
Our study demonstrated age-related decrease in CCT after the seventh decade, however, there was no statistical significance. No significant association of CCT has been found with age,[9] though many studies demonstrated a significant age-related decrease in corneal thickness by about 5 μm per decade in males and 6 μm in females.[10,11] The mean CCT was found to be higher among females. Some studies have confirmed higher CCT measurement in females[12] and lower in others,[5] and some studies have found CCT is independent of gender.[13]
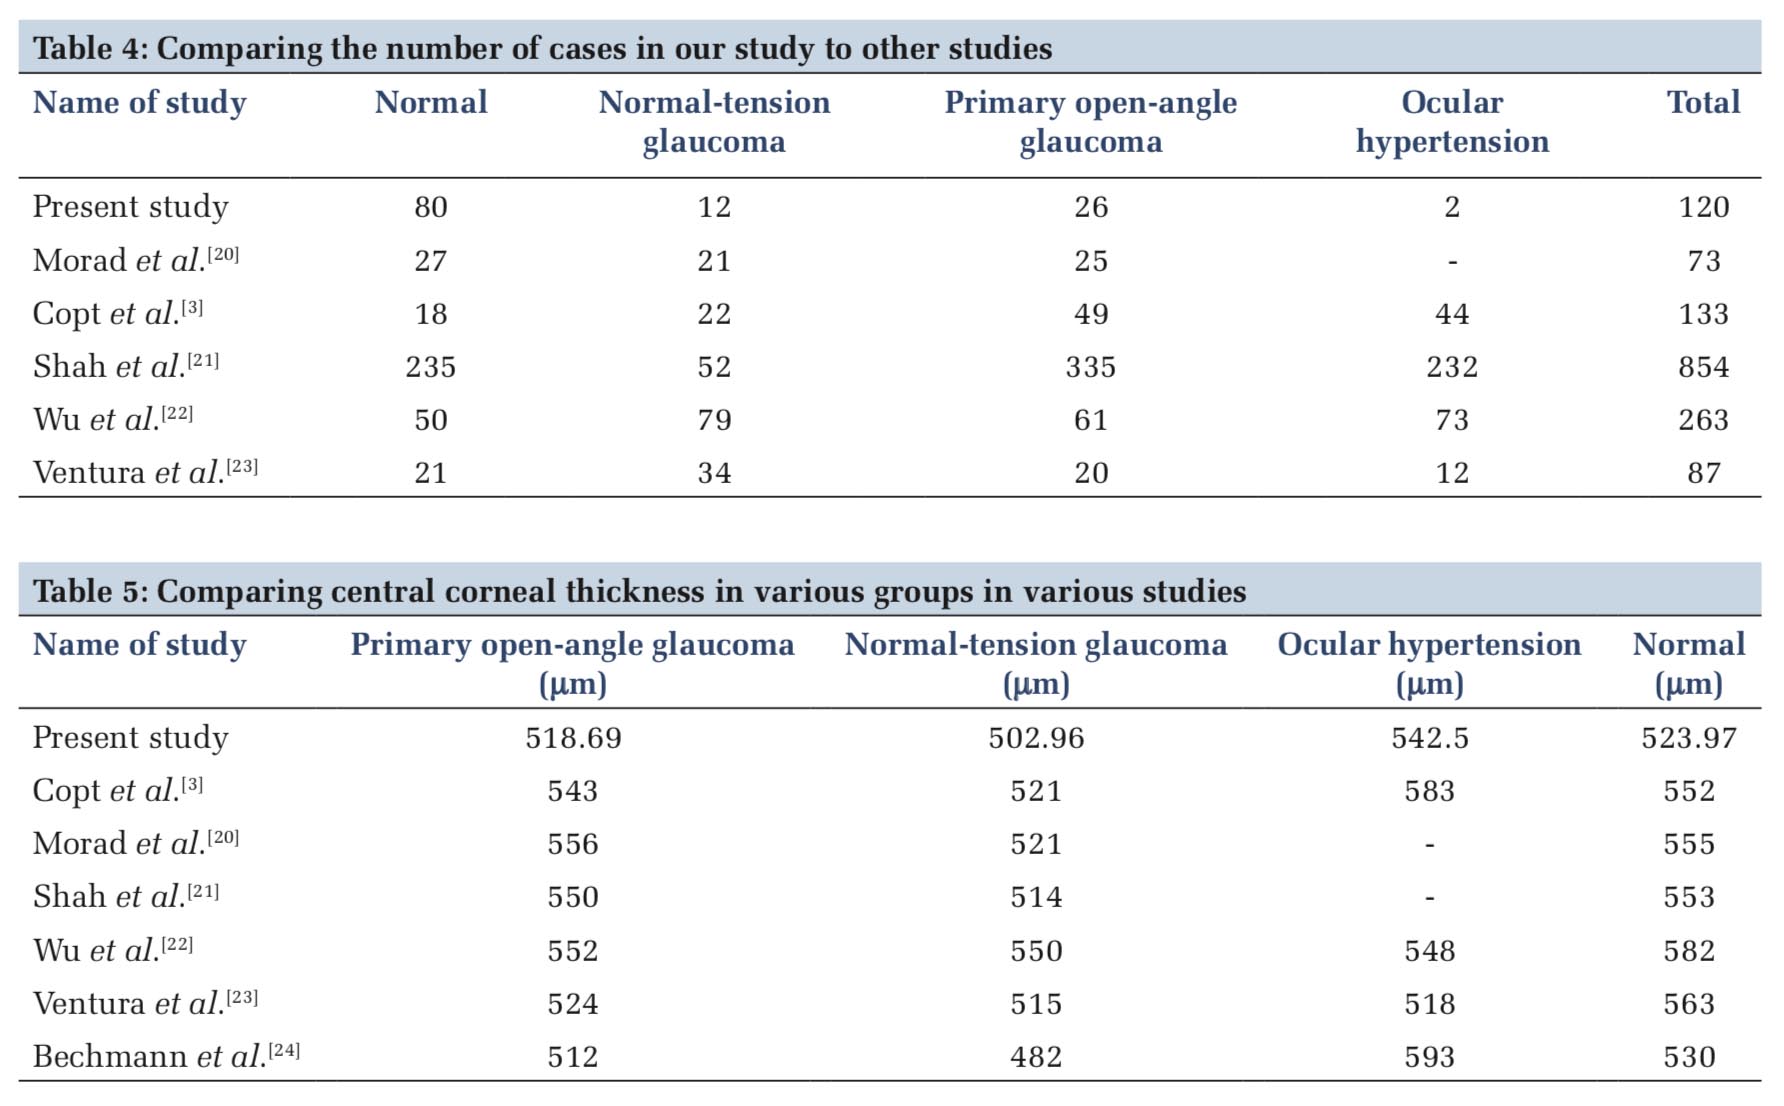
As many studies have shown that patients with NTG have thinner corneas, those with OHT have thicker than the controls; we designed this study to compare CCT of NTG, POAG, and OHT to see whether there is a difference in our population and also to evaluate the effect of CCT measurement on the diagnosis (resultant reclassification) and management of glaucoma patients due to its effect on IOP measurements. A comparison of the number of cases in our study to other studies is shown in Table 4. A comparison of mean CCT in different types of glaucoma in various studies is shown in Table 5. CCT has been found to be significantly lower in NTG and significantly higher in OHT in various studies,[14] but the same has not been seen in our study.
The mean IOPs in our study were low in the POAG as the patients were already on hypotensive drugs at the time of the study. Prostaglandins were the most commonly used hypotensive medications. Patients on prostaglandin analogs had a relatively thinner cornea when compared to the rest. The same has been proven in many studies.[3,15-17] This is explained probably due to their action on matrix metalloproteinases. According to a study, prostaglandins had to be used for at least 8 weeks to produce statistically significant thinning.[15]
CCT by pachymetry in diabetics has been found to be more in some studies.[18] However, in our study, CCT was found to be significantly higher among diabetics only among the controls and CCT was lesser in diabetics among controls (P = 0.005). Various theories have been proposed for increased thickness in diabetics such as altered corneal structures affecting corneal hydration and decreased endothelial permeability in diabetic corneas during the different stages of hypoxia.
Reclassification of patients was done after correcting IOP and 3patients (25%) who were initially diagnosed as NTG were now designated as POAG. Almost one-fourth of NTG patients were reclassified as POAG, whereas in another study,[3] 31% of NTG was reclassified as POAG and 56% of OHT as normal.
Comparison of CCT in various groups in our study and various studies is shown in Tables 4 and 5.[19-24]
Thin cornea has been fund to be an important independent risk factor for glaucoma progression.[25] The reason may be probably due to underestimated IOP which delays treatment or due to associated thin lamina cribrosa, which makes the optic disc susceptible to damage is yet another question to be answered.


CCT was found to be lesser among NTG and higher among OHT in our study. This study did not find any statistical significance among the four groups (POAG, NTG, OHT, and controls). IOP needs to be corrected for CCT before classifying glaucoma.
Subscribe now for latest articles and news.