Journal of Medical Sciences and Health
DOI: 10.46347/jmsh.v9i1.22.343
Year: 2023, Volume: 9, Issue: 1, Pages: 1-8
Original Article
Aparna Mohan1 , Michell Gulabani2 , Asha Tyagi3 , Jubin Jakhar1 , Mahendra Kumar4
1Senior resident, Department of Anesthesiology & Critical Care, University College of Medical Sciences & GTB Hospital, 110095, Delhi, India ,
2Assistant Professor, Department of Anesthesiology & Critical Care,, University College of Medical Sciences & GTB Hospital, 110095, Delhi, India,
3Director Professor, Department of Anesthesiology & Critical Care, University College of Medical Sciences & GTB Hospital, 110095, Delhi, India ,
4Professor, Department of Anesthesiology & Critical Care, University College of Medical Sciences & GTB Hospital, 110095, Delhi, India
Address for correspondence:
Asha Tyagi, Director Professor, Department of Anesthesiology & Critical Care, University College of Medical Sciences & GTB Hospital, 110095, Delhi, India .
E-mail: [email protected]
Received Date:20 July 2022, Accepted Date:28 September 2022, Published Date:01 January 2023
Background: Percutaneous nephrolithotomy (PCNL) surgery may be associated with postoperative Acute Kidney Injury (AKI). Commonest intraoperative risk factors for postoperative AKI include hypotension and hypoperfusion. Intravenous fluids are administered during surgery to optimize intravascular status and thus prevent hypotension. Conventionally, intravenous fluids are administered during surgery using pre-calculated volumes based on maintenance needs. Alternatively, goal-directed fluid therapy using Stroke Volume Variation (SVV) can be used to decide the volume of intravenous fluids. We compared early postoperative AKI following intraoperative use of conventional (group C, n=15) versus SVV directed fluid therapy (group S, n = 17) in patients undergoing PCNL surgery. Methods: This double-blinded pilot study involved 32 adult patients, randomised to two groups according to type of intraoperative fluid therapy (group C or group S). Postoperative AKI was diagnosed as per KDIGO guidelines. Results: Incidence of early postoperative AKI was clinically higher for group S, though statistically similar, as compared to group C (47.1% versus 26.7%) (P = 0.234). Postoperative increase in eGFR, and 24-hour urine output were clinically greater for group S (P > 0.05). Volume of intraoperative fluids infused was significantly lesser for group S (P = 0.000). The incidence of hypotension and requirement of vasopressor to maintain blood pressure was clinically lesser, though statistically similar for group S as compared to group C (P = 0.659). Conclusions: There appears to be a clinical trend of greater incidence of AKI with use of SVV guided therapy despite better intraoperative hemodynamic stability and greater improvement in postoperative urine output and eGFR in the first postoperative day.
Keywords: Percutaneous nephrolithotomy, Acute kidney injury, Fluid therapy, General anesthesia, Blood pressure
Percutaneous nephrolithotomy (PCNL) is a minimally invasive surgery carried out for kidney stone removal and restoration of renal function. It is a treatment of choice for managing large, multiple or complex renal stones.1 Though it is a surgery aiming for renal function restoration, it can paradoxically be associated with significant risk of postoperative Acute Kidney Injury (AKI). 2, 3 There is only some data regarding AKI after PCNL surgery, and the incidence herein is reported to vary from 11% to 16.2%, being higher in those with solitary kidney (25%). 2, 4, 5
The risk of postoperative AKI depends upon the patient’s general condition and ability to respond to physiologic/pathologic changes brought on by surgery. 6 Intraoperative hypotension is a known risk factor for AKI following PCNL surgery. 2 Indeed, hypotension and hypoperfusion are perhaps the commonest risk factors for perioperative AKI following any type of surgery. To prevent intraoperative hypotension, optimization of intravascular status by administering intravenous fluids is a mandatory anesthetic goal. Conventionally, the volume of maintenance intravenous fluids to be infused is calculated according to the rule of 4-2-1, based on weight of the patient. 7
A recent alternative approach to determine volume of intravenous fluid for infusion intraoperatively is the use of goal directed therapy. 7 Herein, fluids are administered based on certain physiological variables or parameters related to the cardiac output or global oxygen delivery. From among various variables used to guide fluid infusion during goal directed therapy, the stroke volume variation (SVV) is a common and successfully used one. 8, 9 It refers to variations in left ventricular stroke volume during inspiration versus expiration, occurring due to intrathoracic pressure changes during intermittent positive pressure ventilation. Since greater hemodynamic stability is reported by using SVV guided fluid therapy, 10 it could improve the perioperative renal function as well. Indeed, in a recent study, the SVV was seen to be a predictor of postoperative AKI in patients undergoing abdominal aortic aneurysm surgery. 11
There is however no evidence of using SVV targeted fluid therapy in patients undergoing PCNL surgeries.
Against the above background, the present study aimed to evaluate and compare postoperative AKI following intraoperative use of conventional versus SVV directed fluid therapy, in patients undergoing PCNL surgery.
The prospective randomized double-blinded pilot study was undertaken after getting approval from the Institutional Ethical Committee-Human Research (IEC-HR), in its meeting held on 13-10-2018 and informed written consent from all participating patients. It is prospectively registered with CTRI (Ref. No. CTRI/2018/12/016693; registered on 17/12/2018).
Adult patients of age between 16 and 65 years scheduled for PCNL surgery under general anesthesia were included in the study. Patients receiving renal replacement therapy or with transplanted kidney; or clinical evidence of significant dysrhythmia, cardiac failure, stroke, coronary heart disease (with left ventricular ejection fraction [LVEF] < 50% where echocardiography was indicated) were excluded.
In the operating room, monitoring including oscillometric noninvasive blood pressure, lead II electrocardiography, pulse oximetry and capnography were instituted. An intravenous line was established and infusion of Ringer’s lactate initiated. Injection morphine (0.05-0.15 mg/kg i.v.) was given.
For all patients, under local anesthesia, radial artery cannulation was performed and connected to VigileoTM system (Edwards Lifesciences, LLC, USA). This system enabled the continuous monitoring of stroke volume and cardiac output by pulse contour analysis, without requirement of external calibration. The SVV was calculated automatically by the monitoring system, as the variation of beat-to-beat stroke volume from the mean value during the most recent 20 seconds data (SVV = SVmax – SVmin / SVmean). Following establishment of optimal arterial waveform, anesthesia was induced using propofol (1-2.5 mg/kg i.v.) followed by vecuronium (0.1 mg/kg i.v.) to facilitate endotracheal intubation. Mechanical ventilation was initiated using tidal volume of 8 ml/kg ideal body weight, and respiratory rate of 10 per minute titrated to maintain end tidal carbon dioxide level of 30 to 40 mmHg. Anesthesia was maintained using isoflurane along with nitrous oxide, along with inspired oxygen concentration of 0.3 titrated intraoperatively to maintain SpO2 ≥ 95%. At the end of surgery, residual neuromuscular blockade was reversed with glycopyrrolate (0.01 mg/kg i.v.) and neostigmine (0.05 mg/kg i.v.). Blood transfusion was used if blood loss exceeded estimated maximum allowable blood loss for a target hemoglobin of ≥ 8 g/dl.
A computer-generated random number table was used for randomizing the patients to receive intraoperative intravenous fluids guided by SVV (Group S) or as per Conventional estimation (Group C). The patient, and the anesthesiologist evaluating for postoperative AKI were not aware of the group allocation, making this a double-blinded trial.
In group C, the fasting deficits and maintenance volumes were calculated using the 4-2-1 estimation of maintenance water requirements and Ringer’s Lactate infused accordingly. 7 Additionally, hypotension was treated with boluses of 100 ml Ringer’s lactate till the mean arterial pressure increased above the hypotensive value (i.e., calculated as fall beyond 20% from baseline).
In group S, whenever the SVV was > 10% in supine position; or > 14% in prone position, a bolus of minimum 100 ml Ringer’s lactate was infused over 2 to 4 minutes. Fluid boluses were repeated every 5 minutes till SVV criteria was met. In case of failure of any response to the bolus fluid, the wait period of 5 minutes was not be adhered to. Unless accompanied by hemodynamic instability, SVV variations were treated only if sustainable for at least 2-3 minutes. In addition, a baseline infusion of 1ml/kg/hr of Ringer’s Lactate was continued in Group S. In both groups, use of vasopressor bolus was left to discretion of the attending anesthesiologist
We followed up patients for incidence of early postoperative AKI (that is up to 48 hours postoperatively) as the primary outcome measure; severity of AKI, as well as postoperative changes at 24 and 48 hours in serum creatinine and estimated glomerular filtration rate.
AKI was defined as per the KDIGO guidelines ie; an increase in serum creatinine of ≥ 0.3 mg/dl above baseline within 48 hours or an increase to ≥ 1.5 times baseline which is known or presumed to have occurred within the prior 7 days; or urine output of < 0.5 ml/kg/hr for 6 hours. 12 The severity was graded as per level of derangement of serum creatinine or urine output. 12 For evaluation of the above outcome measures, baseline serum creatinine value prior to surgery was noted, and it was repeated on the first two postoperative days. Urine output was also to be considered for diagnosis of postoperative AKI in addition to serum creatinine if estimates of hourly collection would be available. The estimated glomerular filtration rate was calculated using the MDRD equation wherein, (18) eGFR = 186 x [serum Cr (mg/dl)]-1.154 × (age)-0.203 × 0.742(for females) × 1.210 (for blacks).
Other observations included demographic parameters viz., age, height, weight, body mass index and gender; surgical details such as duration of surgery, volume of irrigation fluid, and any complications thereof; efficacy of intravascular volume maintenance shown by volume of intraoperative Ringer’s lactate, incidence of hypotension (> 20% fall in mean arterial pressure), usage of vasopressor (mephentermine 3mg intravenous) boluses, intraoperative hemodynamic parameters such as cardiac index, SVV, invasive mean arterial pressure and heart rate; and other risk factors of renal dysfunction such as preexisting diabetes mellitus, hypertension, chronic obstructive pulmonary disease, obesity, nephrotoxic drugs including contrast media.
To record the intraoperative hemodynamic stability, the heart rate, invasive mean arterial pressure and cardiac index were recorded prior to induction of anesthesia (baseline), after intubation and initiation of mechanical ventilation, after change of position, followed by every 15-minute intervals till end of surgery and after any change in position. SVV was also recorded at all the above time points except prior to induction of anesthesia since mechanical ventilation is an essential prerequisite for its measurement. The baseline for SVV was accordingly the value just after intubation and initiation of mechanical ventilation.
Other postoperative outcome measures including postoperative duration of hospital stay, and the preoperative as well as postoperative hemoglobin were also recorded.
Statistical analysis was done using the software SPSS version 23.0. Distribution of quantitative data was checked for normality using K-S test. Normally distributed data is presented as mean ± standard deviation and non-normally distributed data as median [IQR]. Intergroup comparison for qualitative data was done using chi-square or Fischer’s exact test, Mann-Whitney U test for non-normally distributed quantitative data, and t-test for normally distributed quantitative data. For intergroup comparison of repeated measures, general linear model of ANOVA or Mann-Whitney U test with Bonferroni correction was used for normal and non-normal distribution. P value < 0.05 was considered statistically significant. We carried out intention-to-treat analysis. This implied analyzing the outcomes and data of patients in whom intraoperative decision to carry out only URS + DJ stenting was made instead of PCNL (n=2 in each group). The intraoperative duration over which all repeated hemodynamic parameters were recorded ranged up to 105 and 120 minutes respectively for group C and group S. For statistical analysis and comparison of the repeated hemodynamic parameters, the readings for up to 30 minutes after prone positioning were included. This was done consequent to completion of surgery by this time in most cases.
Considering an earlier incidence of postoperative AKI following PCNL surgery (11%), 87 patients are required in each group to detect a fall in incidence to 1%, at significance level of 5%. The present results are from 32 patients constituting a randomized pilot study. Since this was a pilot study, we had planned to recruit 20 patients in each group. However, consequent to COVID induced disruption of non- COVID care in our hospital, only 32 could be enrolled in the specified duration of the study. Thus we are presenting the results for 32 as a pilot study.
Out of the total 33 patients assessed for eligibility, 1 patient who was receiving renal replacement therapy was excluded (Figure 1). Total of 32 patients were randomized into 2 groups, Group C and Group S, with 15 and 17 patients in each group respectively and received intervention. None of the patients were lost to follow up.

The baseline characteristics for both groups were statistically similar (P > 0.05, 95% Confidence Interval) (Table 1). The incidence of various systemic co-morbidities in group C and group S was as follows: hypertension (2 versus 4), diabetes mellitus (0 versus 2), hypothyroidism (1 each), obesity (i.e., BMI > 30 kg/m2) (0 versus 1) and human immunodeficiency virus infection (0 versus 1) respectively. More than 1 co-morbidity was present in some patients.
|
Characteristic |
Group C (n = 15) |
Group S (n = 17) |
P value |
SMD or median difference or RR (95% CI) |
|
Age (years) |
38.4 ± 12.9 |
34.4 ± 12.9 |
0.389 |
-0.31 (-1.033 to 0.414) |
|
Gender (Male : Female) |
9 : 6 |
10 : 7 |
0.787 |
0.98 (0.552 to 1.74) |
|
Height (cm) |
160.3 ± 9.4 |
161.2 ± 7.9 |
0.745 |
0.097 (-0.627 to 0.82) |
|
Weight (kg) |
60 [45-68] |
60 [42.5-71.5] |
0.910 |
0 (-14 to 14) |
|
Body mass index (kg/m2) |
22.6 ± 4.0 |
22 ± 4.7 |
0.695 |
-0.132 (-0.855 to 0.592) |
|
Ideal body weight (kg) |
55.4 ± 10.5 |
56.1 ± 9.1 |
0.840 |
0.071 (-0.652 to 0.795) |
|
Heart rate (/min) |
91 ± 18 |
95 ± 14 |
0.505 |
0.239 (-0.484 to 0.963) |
|
Mean arterial pressure (mmHg) |
104 [90-108] |
100 [93-111] |
0.545 |
3 (-8 to 19) |
|
Oxyhemoglobin saturation (%) |
100 [99-100] |
100 [100-100] |
0.465 |
0 (0 to 0) |
|
Preoperative hemoglobin (gm/dl) |
12.0 ± 1.9 |
12.5 ± 2.3 |
0.463 |
0.264 (-0.46 to 0.987) |
|
Maximum allowable blood loss (ml) |
1254 ± 659 |
1397 ± 793 |
0.588 |
0.194 (-0.529 to 0.917) |
|
Presence of systemic co-morbidities |
4 (26.6) |
5 (29.4) |
1 |
1.103 (0.361 to 3.369) |
Values are mean ± SD or median [IQR] or number of patients (%), SMD-Standardised mean difference, Median difference- Hodges-Lehmann estimation, RR-Relative risk
Incidence of early postoperative AKI (within 48 hours postoperatively) was clinically higher, but statistically similar, for group S as compared to group C (8/17 = 47.1% versus 4/15 = 26.7%) (P = 0.234, 95% Confidence Interval). The diagnosis of postoperative AKI is based on changes in serum creatinine as per the KDIGO guidelines.
The distribution of patients according to severity of AKI was also statistically similar between both groups (P = 0.312, 95% Confidence Interval). From among those who developed AKI, the percentage of patients in group C and group S with grade 1 AKI was 3/4 (75%) and 7/8 (87.5%); and for grade 2: 1/4 (25%) and 1/8 (12.5%). None of the patients developed grade 3 AKI.
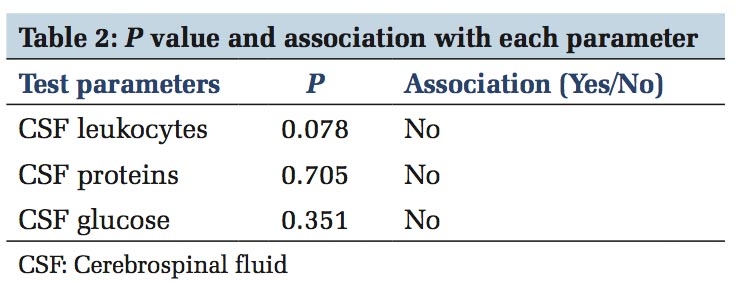
The postoperative change in serum creatinine and estimated glomerular filtration rate (eGFR), on 1st as well as 2nd postoperative day, were also statistically similar between group C and group S (P > 0.05) (Table 2). However, the increase in eGFR and 24-hour urine output were clinically greater on first postoperative day for group S (Table 2). Although the hourly estimates of postoperative urine output were not available, the 24-hour volumes were noted and found to be statistically similar between both groups (Table 2).
|
Characteristic |
Group C (n = 15) |
Group S (n = 17) |
P value |
Median difference (95% CI) |
|
Change in serum creatinine (POD1) (%) |
-10 [-15 to 5] |
-10 [-20 to 15] |
0.986 |
0 (-30 to 20) |
|
Change in serum creatinine (POD2) (%) |
-10 [-20 to 10] |
-10 [-20 to 20] |
0.986 |
0 (-30 to 20) |
|
Change in eGFR (POD1) (%) |
0 [-18 – 0] |
13 [-24 – 0] |
0.994 |
-3.6 (-17.9 to 15.1) |
|
Change in eGFR (POD2) (%) |
-13 [-17 – 0] |
-11 [-29 – 6] |
0.851 |
0 (-21.9 to 25.6) |
|
Urine output (1st postoperative day) (ml/day) |
1400 [1000-2050] |
1900 [950-2400] |
0.198* |
200 (-500 to 900) |
|
Urine output (2nd postoperative day) (ml/day) |
1900 [1450-2000] |
1900 [1250-2635] |
|
170 (-600 to 1100) |
Values are median [IQR]; eGFR = estimated glomerular filtration rate; Median difference- Hodges-Lehmann estimation; POD = postoperative day.
* Value obtained with Mann-Whitney U test, significance at P < 0.017 after being adjusted for Bonferroni correction due to the repeated measurements.
Volume of intraoperative fluids was significantly higher for group C versus group S (P = 0.000, 95% Confidence Interval) (Table 3). Despite this, the need of vasopressor was significantly greater and hypotension (defined as fall in mean arterial presure by >20% from baseline) was clinically higher, though statistically similar for group C versus group S (P = 0.659) (Table 3). The serum lactate remained statistically similar between both groups prior to induction and at the end of surgery (P> 0.05) (Table 3).
|
Characteristic |
Group C (n = 15) |
Group S (n = 17) |
P value* |
SMD or median difference or RR (95% CI) |
|
Intraoperative fluid infused (ml) |
1700 [1425-1700] |
332[198 – 660] |
0.000 |
-1256(-1473 to -956) |
|
Intraoperative vasopressor usage |
7 (46.7) |
0 (0) |
0.002 |
0.059(0.004to 0.957) |
|
Intraoperative hypotension |
13 (86.7) |
13 (76.5) |
0.659 |
0.882(0.634 to 1.227) |
|
Serum lactate (pre-induction) (mmol/l) |
1.3 ± 0.6 |
1.1 ± 0.6 |
0.155* |
-0.453(-1.358 to 0.451) |
|
Serum lactate (end of surgery) (mmol/l) |
1.4 ± 0.3 |
1.2 ± 0.6 |
|
-0.278(-1.182 to 0.627) |
Values are mean ± SD or number of patients (%) or median [IQR], SMD-Standardised mean difference, Median difference- Hodges-Lehmann estimation, RR-Relative risk.
* P-value for inter-group comparison using the repeated measure ANOVA test.
The hemoglobin level was similar between group C and group S on each of pre-defined times i.e., preoperatively, postoperative day 1, as well as on postoperative day 2: 12.0 ± 1.9 versus 12.5 ± 2.3 gm/dl; 10.5 ± 1.6 versus 11.2 ± 2.0 gm/dl; and 10.6 ± 1.7 versus 11.3 ± 2.0 gm/dl respectively. (P = 0.338).
An intergroup comparison showed similar SVV in both groups at each of the predefined time points (P = 0.141), although it was clinically lower for group C as compared to group S (Figure 2). However, the SVV remained above threshold value of 10% in supine position and 14% in prone position on all times. The mean heart rate, invasive blood pressure as well as cardiac index were statistically similar between both groups at all observed time points (P = 0.150, 0.524 and 0.816 respectively) (Figure 3, Figure 4).


The surgical characteristics are represented in Table 4. Duration of surgery and volume of irrigation fluid were similar between both groups (P > 0.05). An intraoperative change of surgical plan to forgo the PCNL after URS with DJ stenting was made in 2 patients of each group (P = 1.000). Number of patients requiring multiple tracts during PCNL, and those with single functioning kidney preoperatively was statistically similar between both groups (P> 0.05) (Table 4). None of the patients in either group had intraoperative hemorrhage, required blood transfusion, or developed a pneumothorax (Table 4).
The electrolyte (serum sodium and potassium) as well as metabolic (pH, serum HCO3, and PaCO2) parameters were similar between group C and group S prior to induction as well as at the end of surgery (P > 0.05, 95% Confidence Interval) (Table 5).
|
Characteristic |
Group C (n = 15) |
Group S (n = 17) |
P value |
SMD or RR (95% CI) |
|
Duration of surgery (mins) |
123 ± 41 |
115 ± 29 |
0.512 |
-0.235(-0.958 to 0.489) |
|
Volume of irrigation fluid (L) |
11.6 ± 6.6 |
10.1 ± 5.9 |
0.510 |
-0.236(-0.959 to 0.487) |
|
Intraoperative change of surgical plan |
2 (13.3) |
2 (12) |
1.000 |
0.882(0.141 to 5.516) |
|
Multiple tracts |
3 (20) |
0 (0) |
0.092 |
0.127(0.007 to 2.275) |
|
Single functioning kidney |
0 (0) |
2 (12) |
0.486 |
4.44(0.230 to 85.84) |
Values are number of patients (%) or mean ± SD, SMD-Standardised mean difference, RR-Relative risk
|
Characteristic |
Group C (n = 15) |
Group S (n = 17) |
P value |
SMD (95% CI) |
|
Serum sodium (pre-induction) (mmol/l) |
139.1 ± 6.7 |
140.4 ± 7.6 |
0. 719* |
0.156 (-0.567 to 0.88) |
|
Serum sodium (end of surgery) (mmol/l) |
144.7 ± 9.5 |
145.0 ± 10.6 |
|
-0.025 (-0.748 to 0.699) |
|
Serum potassium (pre-induction) (mmol/l) |
3.6 ± 0.5 |
3.5 ± 0.5 |
0. 223* |
0.003 (-0.721 to 0.726) |
|
Serum potassium (end of surgery) (mmol/l) |
3.7 ± 0.5 |
3.4 ± 0.5 |
|
-0.677 (-1.4 to 0.047) |
|
pH (pre-induction) |
7.39 ± 0.06 |
7.39 ± 0.04 |
0.359* |
-0.077 (-0.8 to 0.647) |
|
pH (end of surgery) |
7.37 ± 0.10 |
7.33 ± 0.08 |
|
-0.497 (-1.221 to 0.226) |
|
HCO3 (pre-induction) (mmol/l) |
19.9 ± 3.8 |
18.9 ± 2.8 |
0.759* |
-0.304 (-1.027 to 0.42) |
|
HCO3 (end of surgery) (mmol/l) |
17.9 ± 3.0 |
18.4 ± 3.2 |
|
0.143 (-0.58 to 0.867) |
|
PaCO2 (pre-induction) (mmHg) |
33.1 ± 7.7 |
32.1 ± 4.6 |
0.867* |
-0.25 (-1 to 0.499) |
|
PaCO2 (end of surgery) (mmHg) |
31.6 ± 12.3 |
33.3 ± 8.8 |
|
0.241 (-0.508 to 0.991) |
Values are mean ± SD. * P-value for inter-group comparison using the repeated measure ANOVA test, SMD-Standardised mean difference.
This randomized controlled pilot study aimed to evaluate and compare early postoperative AKI in patients undergoing PCNL surgery, following intraoperative use of conventional versus SVV directed fluid therapy. It was a pilot study, and there appears to be a clinical trend of greater incidence of AKI with use of SVV guided therapy despite better intraoperative hemodynamic stability and greater improvement in postoperative urine output and eGFR in the first postoperative day (P > 0.05).
The incidence of postoperative AKI in the control group was 26.7%, wherein conventional intraoperative fluid therapy was used. Previous studies noting postoperative AKI following PCNL surgery are few in number. 2, 4, 5 Herein the incidence was noted to be 11%, 5 16.2%, 2 and 25% 4 respectively, albeit without any mention of intraoperative fluid therapy. Thus, our observed incidence of postoperative AKI in the control group (26.7%) is similar to the previously reported figure of 25%. 4 Postoperative AKI was seen in 47.1% patients of our treatment group, wherein SVV guided intraoperative fluid therapy was used. We could not locate any previous evidence evaluating intraoperative SVV guided fluid therapy for effect on postoperative AKI. There is however some earlier data during non-PCNL surgery, showing decreased renal complications and increased urine output following intraoperative SVV directed fluid therapy. 10, 13 Indeed, we also noted greater improvement in postoperative urine output and eGFR on the first postoperative day, although it was not statistically significant. The previous studies did not evaluate occurrence of AKI per se and hence the same cannot be compared.
Given the much greater incidence of AKI with SVV guided therapy, it is tempting to conclude its detrimental effect on renal function. However, there are reasons to desist against a conclusive result at present. Firstly, this is only a pilot study and thus not adequately powered. Secondly, the higher incidence of AKI is contradicted by the clinical trends for better renal function on first postoperative day (urine output and estimated glomerular filtration rate) as well as greater intraoperative hemodynamic stability (lesser hypotension and vasopressor usage) with the use of SVV guided fluid therapy. Intraoperative hypotension is well-known to be perhaps the commonest risk factor for causing perioperative AKI. 2, 12 It is possible then, that the higher incidence of AKI based on serum creatinine could merely be a reflection of relatively lower volumes of fluid therapy used with SVV guided therapy. The role of serum creatinine for diagnosing AKI is itself riddled with limitations, though no substitute has been discovered despite years of research. Lastly, despite randomization, patients with risk factors for postoperative AKI were greater in those who received SVV directed therapy. These associated risk factors included presence of a single functioning kidney, preoperative hypertension, diabetes mellitus and obesity. 2, 4, 5
We noted that majority of the patients with postoperative AKI, in either group, had a mild disease (stage 1), with none developing the most severe form (stage 3). Previously, only 1 out of 3 studies evaluating postoperative AKI following PCNL surgery noted its severity distribution. 4 Herein, the severity distribution showed more severe stages of AKI, probably because the study was conducted solely in patients with solitary kidney undergoing PCNL surgery, an independently associated risk factor of AKI. In our patients, those with solitary functioning kidney were 0% and 12% among those receiving conventional/SVV guided fluid therapy respectively.
Thus, our findings suggest a clinical utility of SVV guided fluid therapy for maintaining hemodynamic stability during PCNL surgery. Effect of SVV guided fluid therapy on postoperative renal function however will need further research, being guided by the present observations.
We thus recommend that using SVV guided intraoperative fluid therapy in patients undergoing PCNL surgery under general anesthesia is feasible and safe in terms of maintaining fluid balance as well as hemodynamic stability. The failure of better intraoperative hemodynamic stability to translate into greater preservation of renal functions with SVV directed therapy will need further research.
Subscribe now for latest articles and news.