Journal of Medical Sciences and Health
DOI: 10.46347/jmsh.2016.v02i01.004
Year: 2016, Volume: 2, Issue: 1, Pages: 18-23
Original Article
B J Rashni1, Sultana Furruqh2, Bhutesh Sharma3
1Post-graduate, Department of Biochemistry, St. John’s Medical College and Hospital, Bengaluru, Karnataka, India,
2Professor, Department of Biochemistry, St. John’s Medical College and Hospital, Bengaluru, Karnataka, India,
3Lecturer, Department of Biochemistry, St. John’s Medical College and Hospital, Bengaluru, Karnataka, India
Address for correspondence: Dr.Rashni.B.J, Postgraduate, Department of Biochemistry, St. John’s Medical College and Hospital, Sarjapur road, Bangalore, Karnataka, India. E-mail: [email protected]
Background and Objectives: Standardization for reporting serum protein electrophoresis (SPE) like many other specialized investigations is now a global issue with respect to many varied validated, methodologies, and different styles of reporting. Specific criteria or recommendations are needed which address, the changes in the variations in serum protein, albumin, globulin levels with respect to the wide reference range of these fractions expressed in g/dL. Hence, this study intends to evaluate the interpretation and significance of the reporting pattern of SPE by cellulose acetate method in a tertiary care hospital.
Materials and Methods: A total of 470 cases requested for SPE by cellulose acetate method in College Lab, Department of Biochemistry, St. John’s Medical College and Hospital were included in the study.
Results: A significant association was observed between all the protein fractions and total protein (P < 0.001), though alpha 1 globulins does not. Also, observed that individual protein fractions showed correlation with gram and percentage expressions (r > 0.75). The majority of relative increase in protein fraction by percentage was observed for alpha 2 globulins (P < 0.05). However, relative decrease by percentage was seen only in albumin.
Conclusion: It was seen that the SPE reporting could be enhanced with further information such as relative percentage to individualize the report and a note on the methodology to add specific information. Further studies are required to include general interpretive commenting, keeping in mind relative percentage, and small paraprotein bands.
KEY WORDS:Cellulose aceta te method, relative percentage, serum protein electrophoresis.
IntroductionSerum protein electrophoresis (SPE), from 1937 onward to the discovery of the existing techniques continues to be a simple, reliable and specialized biochemical investigation of the 21st century. It is used in separating different serum protein fractions based on charge by mass ratio under the influence of an electrical field. The serum protein fractions are separated into albumin and globulins fractions (alpha 1 globulin, alpha 2 globulin, beta globulin, and gamma globulin). Factor’s affecting the mobility of the particles includes size and shape of particles, the ionic strength of solution, viscosity and temperature of the medium.[1-3] A serum protein electrophoretogram is used as an inextricable tool for diagnosing paraproteinemia, hemoglobinopathies, immune deficiency, and genetic abnormalities. It is also used as an aide with other investigations in diagnosing liver diseases and various other disorders such as nephrotic syndrome, malignancies, and collagen vascular disease. Above all, it is used in monitoring the treatment of patients with multiple myeloma.[1-6] The core elements of SPE that needs quantitative reporting are total protein (TP), albumin, globulin, and paraproteins when present. Although the presence and amount of paraprotein is of primary interest to clinicians, other important information can also be derived from the other protein fractions (alpha globulins, beta globulins, and gamma globulins). This information is conveyed by reporting the quantitative values of each protein fractions and its relative percentage together with interpretive commenting.[2,4] There are no specific criteria or recommendations in Indian Studies and Journals which address, the changes in the variations in serum protein, albumin, globulin levels with respect to the wide reference range of these protein fractions expressed in g/ dL. It becomes necessary to evaluate the reporting of these protein fractions at varied points of the reference range which deliver clear information to the clinician to assist in the diagnosis and prognosis of the patient. In view of these lacunae, this study was taken up to evaluate the reporting of different protein fractions obtained and also to study the relevance and significance of SPE reporting in clinical diagnosis. Materials and MethodsThe sources of the data were all the patient’s serum samples requested for SPE by cellulose acetate method during September 2013 to December 2014 in the St. John’s Medical College Biochemistry Lab, Bengaluru. A total of 470 subjects were included in the study. About 5 ml of blood was collected under aseptic precautions. Blood samples are allowed to clot in the collected vacutainer completely at room temperature for 15-30 min and subjected to centrifugation at 3000 rpm for 10 min to separate the serum. SPE was done using Genios Electrophoresis instrument which provides the electrophoretic separation of proteins. This mobility pattern was visually interpreted and quantitated by densitometry at 600 nm, in which, the relative percentage of each protein fraction is calculated automatically. Serum TP and serum albumin were analyzed by modified Biuret method and a bromocresol purple method respectively using Siemens Dimensions RxL and ExL instrument. The study was approved by ethical committee of the institution. Inclusion criteria All the patient’s serum samples requested for SPE, which is sent to the Department of Biochemistry, St. John’s Medical College and Hospital (SJMCH) between the periods of September 2013 and December 2014, were included. Exclusion criteria Exclusion of samples as per the rejection criteria of Standard Operating Procedure for Protein Electrophoresis in the Biochemistry Department, SJMCH: Unlabeled, wrongly labeled, contaminated specimens, turbid samples collected without refrigeration. Statistical analysis Descriptive statistical analysis has been carried out in the present study. Results on continuous measurements are presented on mean ± standard deviation and results on categorical measurements are presented in number (%). P < 5% was considered as significant. Chi-square test and Fischer’s exact test were used to find out the association between the categorical study variables. Pearson’s rank correlation is used to find the correlation between gram and percentage of protein fractions. The data were entered on a Microsoft Excel spreadsheet and analyzed using SPSS version 16. Microsoft word and Excel have been used to generate graphs and tables.
ResultsThere were a total of 470 subjects included in the study with mean age of presentation 32 years, 272 subjects (57.87%) were males and 198 subjects (42.13%) were females.
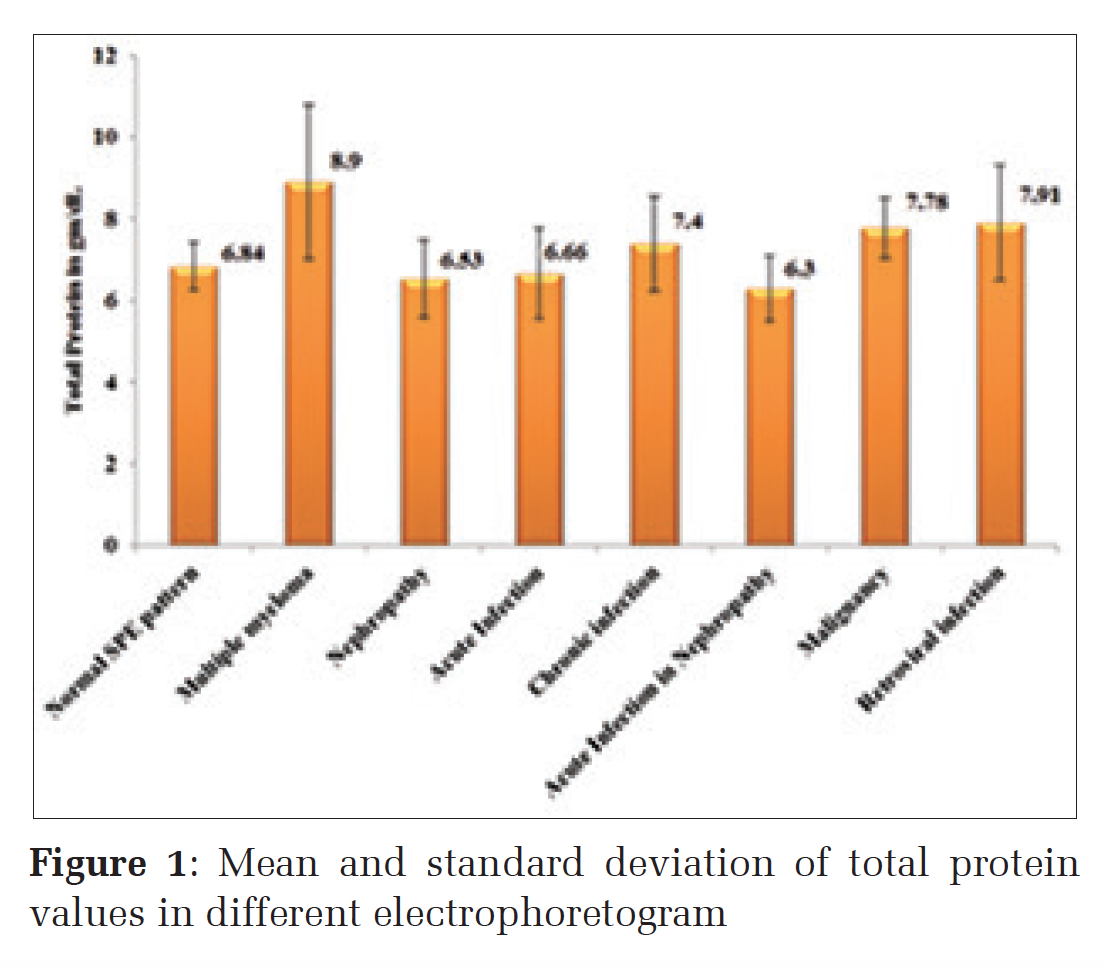
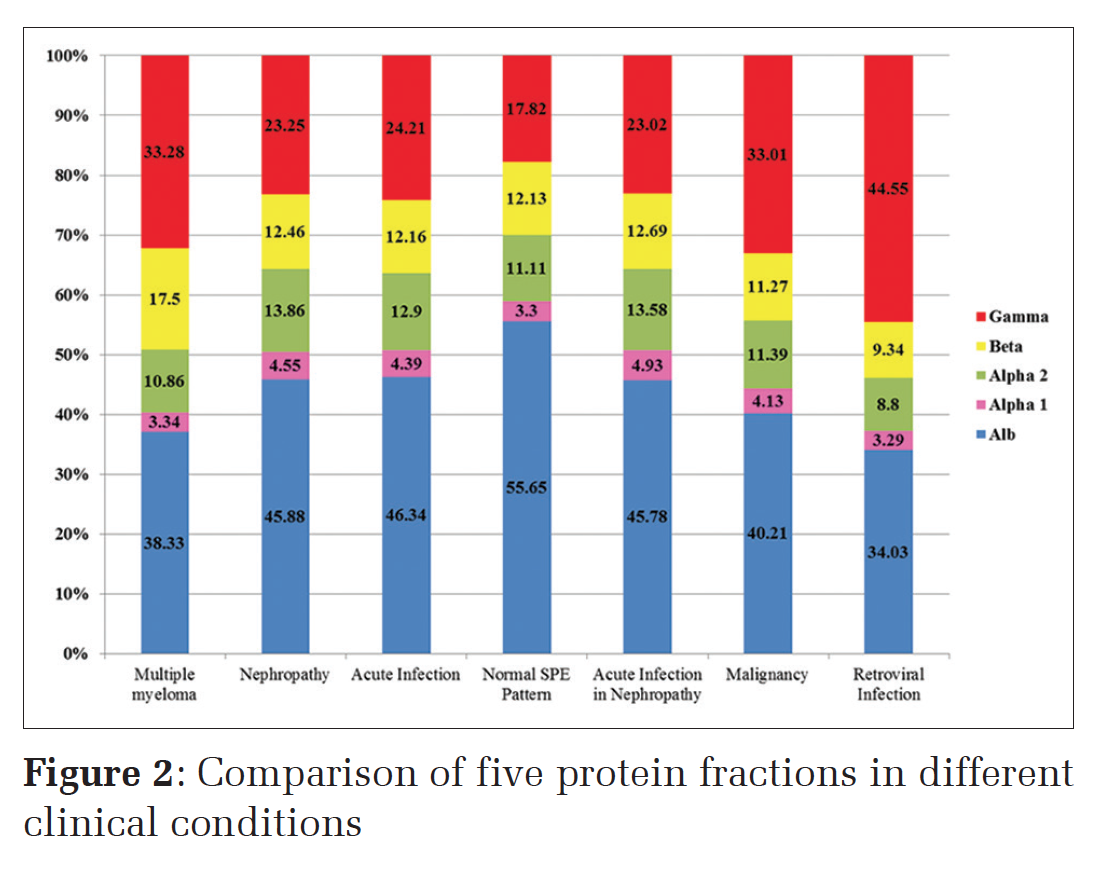
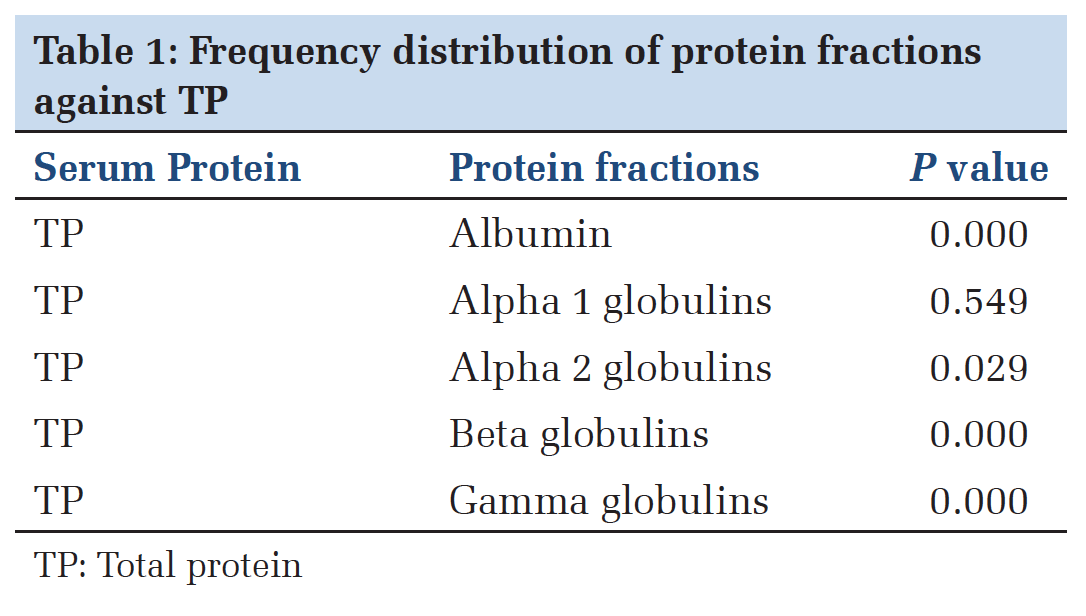
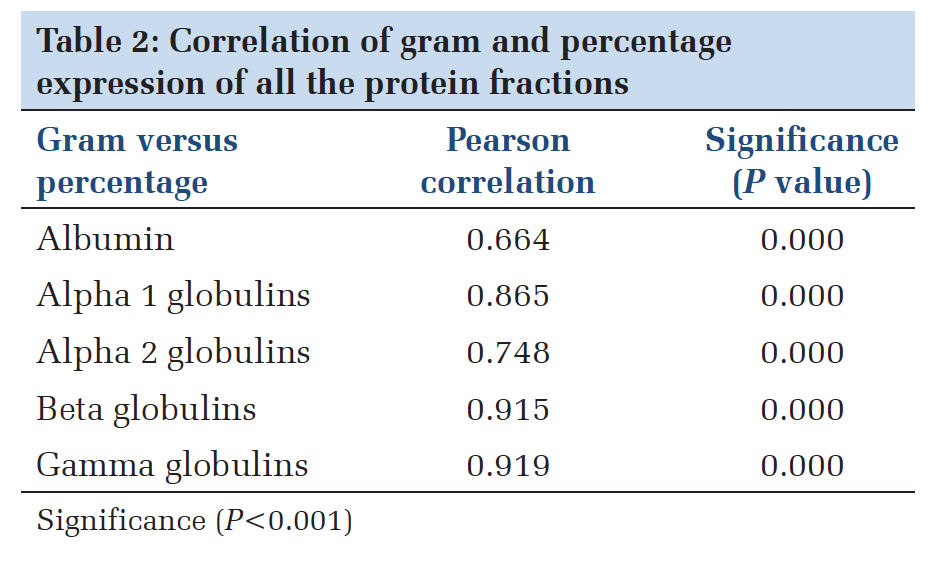
The mean TP values were within biological reference interval (BRI) in acute infections and nephropathy but were higher than BRI in chronic infection, malignancy and retroviral infection with the highest in multiple myeloma cases (Figure 1). Comparison of five protein fractions in different clinical conditions showed the highest gamma globulins fraction in retroviral infection followed by multiple myeloma and malignancy (Figure 2). Except alpha 1 globulins, all the other protein fractions (albumin, alpha 2 globulins, beta globulins, gamma globulins) had statistically significant association with TP values (Table 1). A significant correlation observed between gram and percentage expression with the strongest correlation for gamma globulins (0.919), followed by beta globulins (0.915), alpha 1 globulins (0.865) and alpha 2 globulins (0.748), with least correlation observed for albumin (0.664) (Table 2).
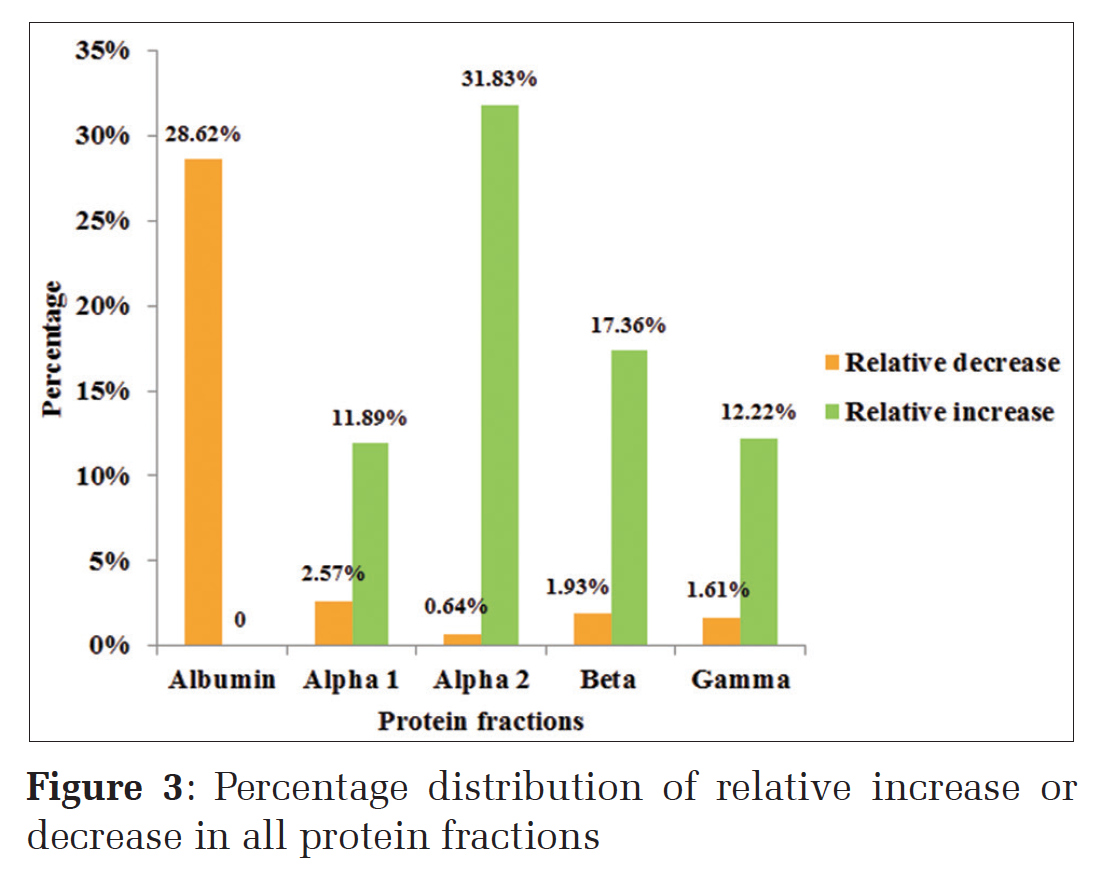
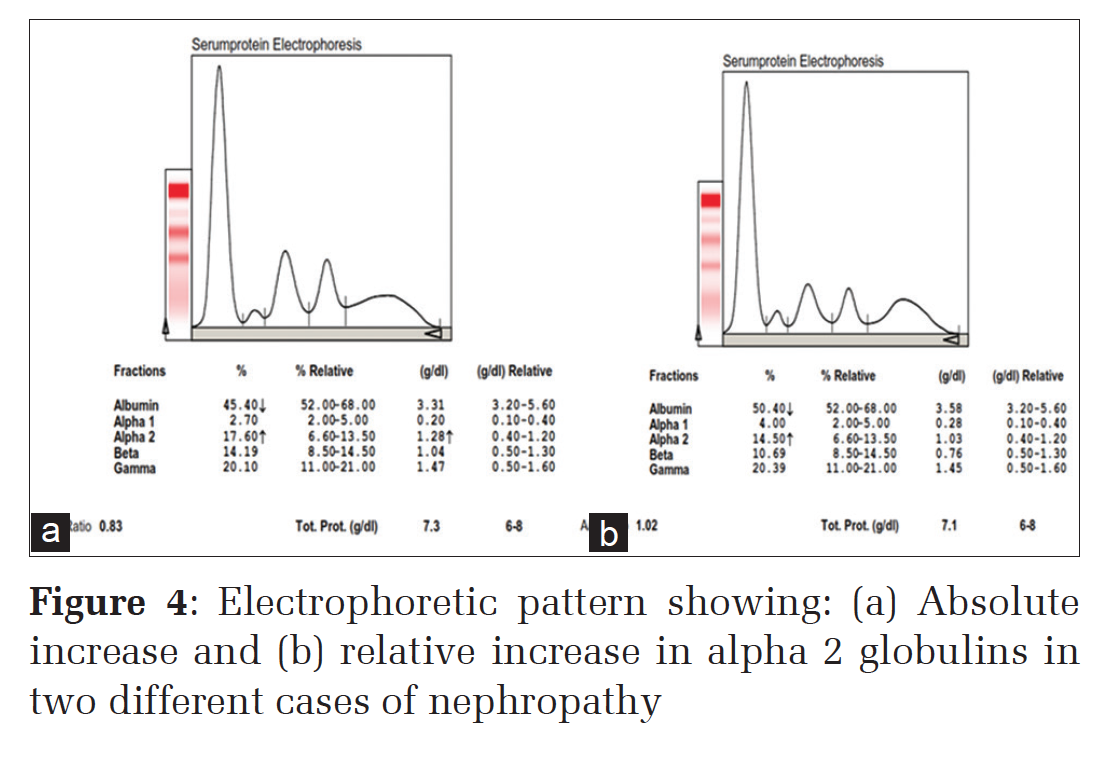
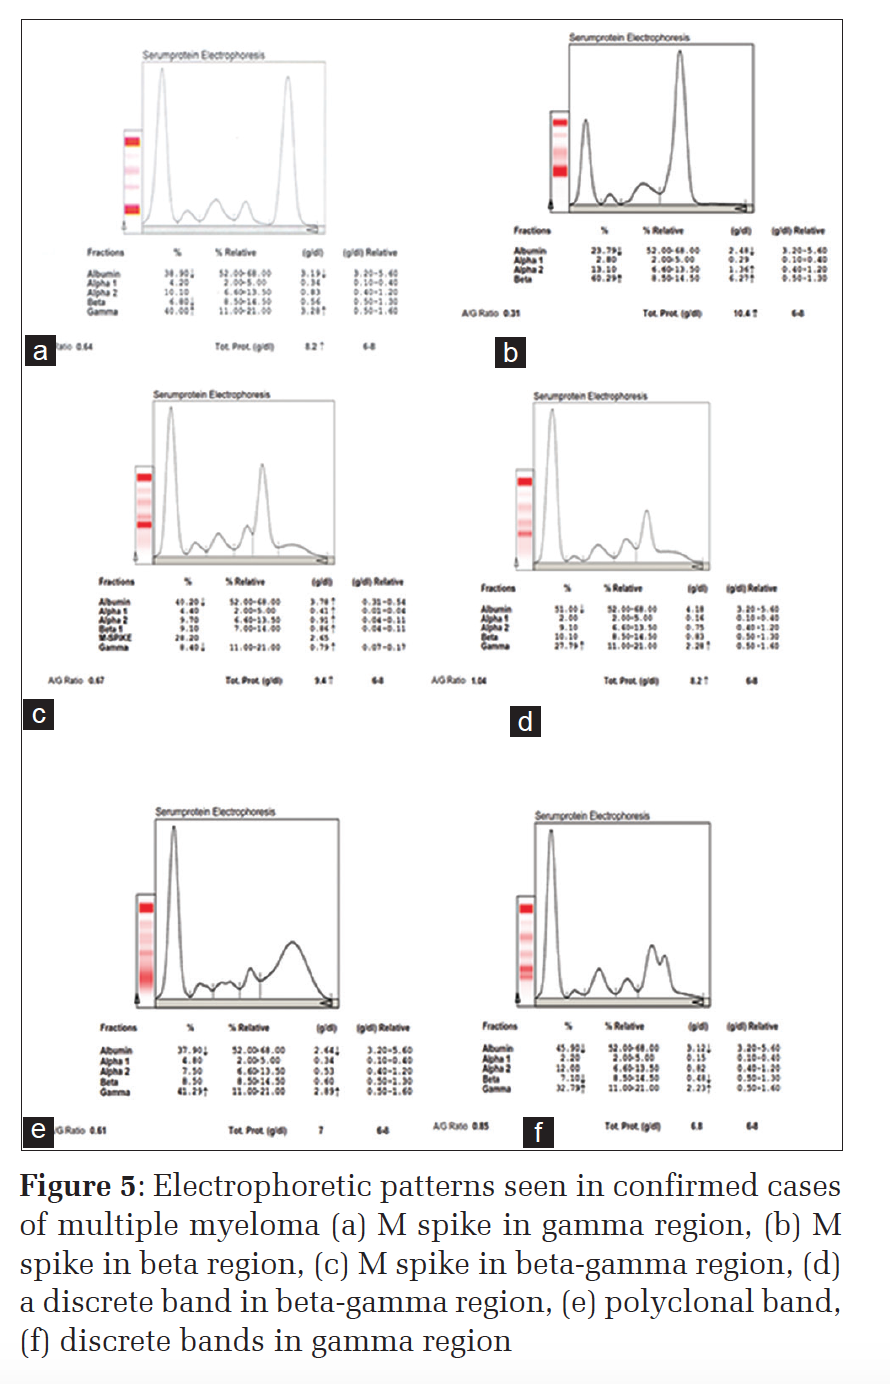
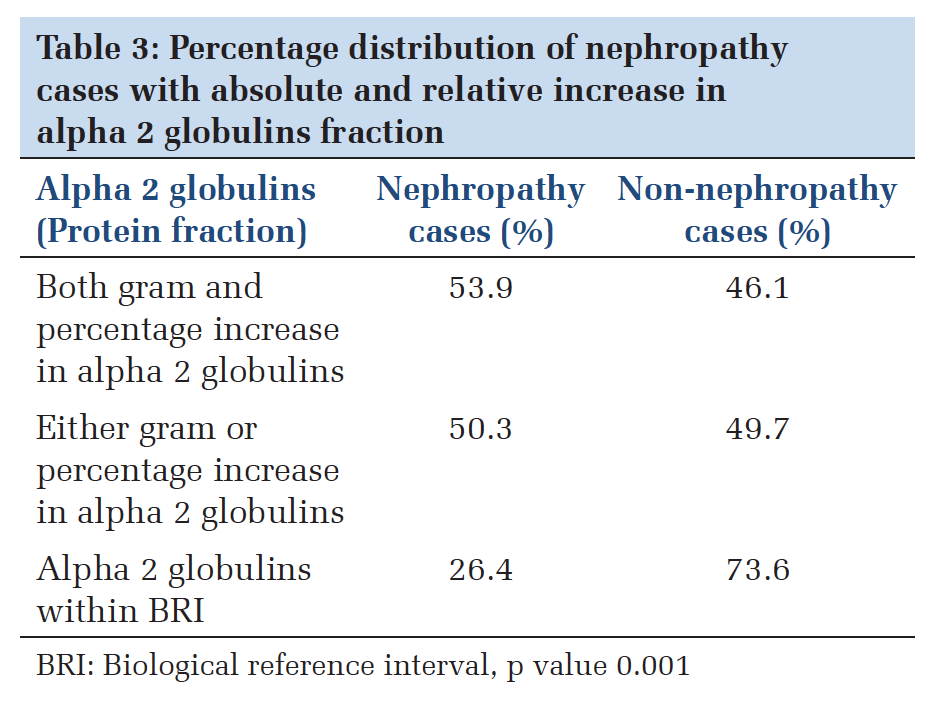
Relative decrease either in gram or percentage was observed the highest for albumin fraction (28.62%), and relative increase either in gram or percentage was observed highest in alpha 2 globulins fraction (31.83%) followed by beta globulins (17.36%) and gamma globulins (12.22%), respectively (Figure 3). Furthermore, electrophoretic patterns in two different cases of nephropathy with absolute increase (both gram and percentage) and relative increase (either gram or percentage) in alpha 2 globulin fractions shown in Figure 4. 53.9% nephropathy cases had alpha 2 globulins fraction increase in both gram and percentage (absolute increase), 50.3% had either gram or percentage increase (relative increase) and were statistically significant with P < 0.005. The nephropathy cases with both gram and percentage within BRI (26.4%) could not be elucidated (Table 3). Among the total 470 subjects, 20 were newly diagnosed multiple myeloma cases. The majority of these cases had M spike in gamma region, beta region and beta-gamma region with quite a few having discrete bands and polyclonal band in betagamma region (Figure 5).
DiscussionTThe major aspect of SPE reporting involves variation in the different protein fractions (albumin, alpha 1 globulins, alpha 2 globulins, beta globulins, and gamma globulins) in accordance with the different clinical conditions which needs to be addressed. The study conducted was a descriptive study in the Department of Biochemistry, SJMCH, a tertiary care centre to evaluate the SPE by cellulose acetate method. A total of 470 cases were requested for SPE of which 272 (57.87%) were males, and 198 (42.13%) were females. The mean age of cases was 31.88 ± 13.41. |
TP and other protein fractions in various clinical conditionsThe change in the pattern of TP in various clinical conditions in comparison with a normal/reference electrophoretogram showed an average of 6.8 ± 0.59 which was in accordance with the studies done by Luetscher[7] and Kaplan and Savory[8] where average TP was 6.5 g/dL and 7.5 g/dL respectively. Whereas in multiple myeloma, the mean TP value in our study was higher with 8.9 ± 1.9 which was similar to the studies done by Kyle[6,9,10] and Donald[11] in which TP was 9.1 g/dL and 8.5 g/dL, respectively, and is mainly due to the increase in monoclonal immunoglobulin band. Cases of malignancy and retroviral infection in our study, also showed higher TP values 7.78 ± 0.75 and 7.91 ± 1.41 respectively which are similar to the studies done by Simeon and Rukari[12] and Donald[11] and was mainly due to increase in an immunoglobulins, but they also commented saying that it depends mainly on the stage of disease condition. There are few articles with monoclonal bands in the gamma region in cases with malignancy and retroviral infections.[13,14] In nephropathy, in our study, the mean value was noted as 6.53 ± 0.96 which is on the lower side of the normal and was similar to the study done by Longsworth et al.,[15] Longsworth and Macinnes[16] and Chew et al.[17] The lower TP value is mainly due to the loss of low molecular weight proteins in the urine. In acute infections also TP values were similar to nephropathy (6.66 ± 1.11). These are similar to the study done by Azim et al.[18] and Simeon and Rukari.[12] Hypoalbuminemia is seen in multiple myeloma, nephropathy, chronic infection, malignancy, and retroviral infection in our study and was similar to the study done by Connell et al.,[4] Kyle,[6,9,10] Azim et al.[18] and Vavricka et al.[19] The hypoalbuminemia was mainly due to malnutrition and protein loss. Alpha 1 globulin and alpha 2 globulin fractions in our study showed an increase in acute infection, acute on chronic infection (malignancy and retroviral infection) and were similar to the study done by Azim et al.,[18] Vavricka et al.,[19] Simeon and Rukari[12] This increase was mainly due to increase in acute phase proteins present in these fractions. Furthermore, alpha 2 globulins were increased mainly in nephropathy cases which were in accordance with the study of Longsworth and Macinnes,[16] Connell et el.,[4] and Vavricka et al.[19] studies. Alpha 2 globulins are increased mainly due to loss of low molecular weight proteins and retention of only alpha 2 macroglobulins. Some studies have differentiated SPE patterns according to the different renal conditions (acute glomerulonephritis, nephrotic syndrome and endstage renal disease). Beta globulins were increased mainly in iron deficiency anemia due to increase in transferrin levels and were similar to the previous studies.[18,20]
TP values and other protein fractionsIn this study, the TP values were also associated with all individual protein fractions. The protein fractions were grouped as less than BRI, within BRI and more than BRI and then compared with their respective TP values. All the fractions except alpha 1 globulins showed good correlation with the P < 0.05. This finding is similar to the study done by Chow[21] in which they found a significant positive correlation between TP and albumin, and a negative correlation between albumin and alpha 1 globulins in acute and chronic infections, though other fractions were not correlated.Gram and percentage correlationThe study also showed a good correlation between the gram and percentage expression of the BRI of all the protein fractions. This finding helps us in giving a definite increase or decrease in any of the protein fractions seen in the serum electrophoretogram.Prevalence of relative changes in all the protein fractionsIt was observed in our study, that relative decrease (either gram or %) in electrophoretogram pattern was more relevant with the albumin fraction. Alpha 2 globulin fraction showed the highest significance among the relative increase (either gram or %); though other fractions also showed significant relative increases. This explains the relevance of the SPE report which gives information on percentage distribution and gram distribution which could be more clinically significant with relative percentage distribution with reference to the protein fractions of the individual cases.The analysis was done with alpha 2 globulins as mentioned in Table 3, as the majority of sample requested were from the Department of Nephrology. The study showed absolute (both gram and percentage) as well as relative (either gram or percentage) increase in alpha 2 globulins fraction which was correlated statistically to nephropathy cases with P < 0.005. This shows that an assessment of the relative percentage of different protein fractions done by the instrument’s software in relation to the unique TP value of the patient is of clinical relevance. Whereas alpha 2 globulin values within BRI were not statistically significant as the percentage of established nephropathy cases were less (26.3%); comprehensive studies could be more conclusive.
Paraprotein bandIn our study, a mean age of presentation of multiple myeloma was 62 years. 10% of cases were below 40 years and 90% of cases were above 41 years. The majority of cases were between 61 and 80 years. Male to female ratio was 2.3:1 showing that multiple myeloma is more common in males compared to females.[6,9,10] Out of 20 multiple myeloma cases Journal of Medical Sciences and Health/Jan-Apr 2016/Volume 2/Issue 1 23 (based on International Myeloma Working Group criteria),[23] 50% of them[10] had gamma globulins more than 3 g/dL and the remaining 50% had gamma globulins < 3 g/dL. These are inconsistent with Mayo Clinic studies,[6,9,10] Tripathy[24] and Chopra et al.[25] studies. Furthermore, 55% of the multiple myeloma cases had M spike in the gamma region, 10% in beta region, 25% had discrete band either in beta or gamma region with the remaining 5% showed hypergammaglobulinemia. The occurrence of discrete/paraprotein bands usually in beta-gamma region or further toward the albumin region should be reported with a note for further investigations like “immunoelectrophoresis suggested” to differentiate between a transient and lifelong follow-up.
|
ConclusionThe SPE reporting could be enhanced with further information such as relative percentage to individualize the report and a note on the methodology. The reporting could also be done in parallel with other investigations. Further studies are required to include general interpretive commenting, keeping in mind relative percentage, and small paraprotein bands. |
Subscribe now for latest articles and news.