Journal of Medical Sciences and Health
Year: 2023, Volume: 9, Issue: 1, Pages: 99-103
Original Article
Banur Raju Archana1 , Sampath Sangeetha2
1Associate Professor, Department of Microbiology, Rajarajeswari Medical College & Hospital, Bangalore, Karnataka, India,
2Professor & HOD, Department of Microbiology, Rajarajeswari Medical College & Hospital, Bangalore, Karnataka, India
Address for correspondence:
Banur Raju Archana, Associate Professor, Department of Microbiology, Rajarajeswari Medical College & Hospital, Bangalore, Karnataka, India.
E-mail: [email protected]
Received Date:12 August 2021, Accepted Date:20 October 2022, Published Date:04 May 2023
Background: Sepsis is a life-threatening infection, responsible for tremendous morbidity, mortality and healthcare expenditure worldwide. Sepsis is characterized by non-specific symptoms and clinical diagnosis remains difficult. C Reactive protein (CRP) and procalcitonin (PCT) are now days used as surrogate markers of sepsis. Aim: To determine PCT levels in patients with suspected sepsis and its correlation with CRP and total leucocyte count (TLC). Material & Methods: The retrospective study was conducted in tertiary care hospital in India. Adults patients (> 18 years) admitted to Intensive care unit in the hospital during study period, fulfilling the ACCP criterion for the diagnosis of sepsis were included in the study. Data was collected using laboratory software maintaining confidentiality. Results: The study comprised of 190 patients. Patients were divided into four groups based on PCT values and severity of sepsis. Out of 190 patients, PCT was positive in 135 patients. The CRP and TLC levels were distributed into the four PCT groups and their correlation with PCT was studied. For PCT values between 2-10ng/ml, >10ng/ml CRP showed statistically significant correlation with p value <0.05, whereas correlation of TLC with PCT was poor. Conclusion Procalcitonin along with CRP is a better diagnostic tool for sepsis but their correlation in context to TLC was poor. Due to lack of an ideal isolated marker, our study mandates multidisciplinary approach for diagnosis of sepsis.
Keywords: Sepsis, Procalcitonin, C reactive protein, Total leucocyte count, Culture
Sepsis is defined as a life-threatening organ dysfunction that occurs due to a dysregulated host response to infection. 1 It is responsible for tremendous morbidity, mortality and health care expenditure worldwide. Sepsis is characterized by non-specific symptoms and clinical diagnosis often remains difficult. Early detection and timely intervention of sepsis results in better clinical outcome. 2, 3 Blood culture remains the gold standard for diagnosis of sepsis, but diagnostic delay and contamination pose major impedance for early diagnosis. 4, 5 C Reactive protein (CRP) and Procalcitonin (PCT) are nowadays used as surrogate markers of sepsis. 6, 7
PCT, a precursor of calcitonin, used as a biomarker for diagnosis and prognosis of moderate to severe bacterial infections and as a guide to antibiotic therapy. PCT is detectable 3 to 4 hrs following an infection, it peaks at 6 to 12 hrs and has a half-life of about 24 hrs. 5, 8 This favourable kinetic profile, and its specificity and sensitivity for bacterial infection make it suitable for diagnosis and disease progression monitoring. As a biomarker, PCT is valued for its specificity in differentiating between bacterial and nonbacterial inflammation. 9, 10
Total leucocyte count (TLC) and CRP are also used as biomarkers for inflammation, however neither of these tests achieve 100% sensitivity. CRP shows a delayed increase during bacterial infection, resulting in false-negative results in early stages of the disease. 11 CRP can also be elevated in viral infections, limiting its ability to discriminate between bacterial and viral aetiologies. Various studies in literature have emphasized their role in inflammatory disorders and infections. 12, 13, 14 Our study was designed with the objective to determine PCT levels in patients with suspected sepsis and to correlate PCT levels with CRP and total leucocyte count (TLC).
A retrospective study was conducted over a period of 6 months, from July to December 2019 in a tertiary care hospital in South India. A total of 190 patients were included in the study. Sample size was calculated based on prevalence of suspected cases of sepsis in our hospital using Yamane Equation. The data was collected from all adult patients more than 18-year age, admitted to Intensive care unit in the hospital, fulfilling the American College of Chest Physicians (ACCP) criteria for the diagnosis of sepsis.
Inclusion criteria: Presence of 2 or more of the following features along with suspected or proven source of infection. Temp >38°C (100.4°F) or <36°C (96.8°F), Heart rate >90, Respiratory Rate >20 or PaCO2< 32mmHg, WBC >12,000/mm3, <4000/ mm3 OR >10% bands.
Exclusion criteria: Patients with cardiogenic shock, recent major surgery, severe trauma, severe burns, small cell lung carcinoma, medullary carcinoma of thyroid, were excluded from the study, as PCT is non-specifically elevated in these conditions.
The study was approved by the institutional Ethical committee. Data was collected using laboratory software maintaining confidentiality.
Procalcitonin was measured using FIA meter (Finecare) fluorescence immunoassay rapid quantitative test, PCT value of >0.5 was considered significant as per manufacturer’s instructions. CRP concentrations were measured using latex agglutination test, TLC was measured by automated haematology analyser. Blood cultures were done by the automated BacTec BD system with strict aseptic precautions.
Data were analysed by using descriptive and inferential statistics such as mean, percentage, standard deviation, range, correlation, Z test and Chi-square test. P value <0.05 was considered statistically significant.
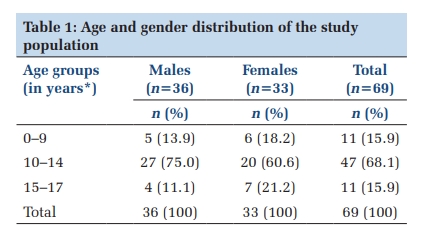
The study comprised of 190 patients, 105(55.3%) males & 85(44.7%) females. The mean age of the study population was 53.45 years. Patients were divided into four groups based on PCT values and severity of sepsis (Table 1). PCT value of 0.5 ng/ml or more was considered as positive for sepsis. PCT was positive in 135 patients. The minimum value of PCT obtained was 0.1 ng/ml and maximum was 100 ng/ml, mean being 12.73 ng/ml (Table 2).
|
PCT (ng/ml) |
Interpretation |
|
<0.5 |
Local bacterial infection |
|
0.5‑1.9 |
Systemic infection cannot be excluded |
|
2‑10 |
Sepsis |
|
>10 |
Severe bacterial sepsis or septic shock |
|
PCT |
<0.5 |
0.5 - 2.0 |
2.0-10.0 |
>10 |
|
No. sample |
55(28.94%) |
43(22.63%) |
43(22.63%) |
49(25.78%) |
|
Mean |
0.23 |
1.11 |
4.83 |
43.89 |
|
SD |
0.13 |
0.46 |
2.42 |
30.40 |
|
Median |
0.19 |
1.01 |
4.32 |
32.14 |
|
Min |
0.1 |
0.5 |
2.07 |
10.63 |
|
Max |
0.49 |
1.99 |
9.9 |
100 |
Out of the 190 cases, 106 (55.79%) patients had a positive culture and 84 (44.21%) patients had no growth on culture. Of the 106 isolates 38 (35.84%) were from urine, 21 (19.81%) from sputum, 21 (19.81%) from pus, 16 (15.09%) from blood and 10 (9.43%) from multiple samples. In the present study, it was observed that out of 106 isolates, 87(82.07%) were gram negative and 19(17.92%) isolates were gram positive. Commonest bacteria grown was Escherichia coli (54.21%) followed by Klebsiella pneumoniae (19.28%) and Pseudomonas aeruginosa (6.02%). The mean PCT values of patients with gram negative isolates (11 ng/ml) were higher than gram positive isolates (15.9 ng/ml) but the difference of PCT values in the two groups were not statistically significant. Comparison of mean PCT & CRP values in culture positive patients depicted in Figure 1.

The CRP and TLC levels were distributed into the four PCT groups (Table 3). The minimum value of CRP obtained was 6 mg/l and maximum value was 96 mg/l. The minimum value of TLC obtained was 4,220 cell/ cu mm and maximum was 39,060 cell/ cu mm. Correlation of PCT with CRP & TLC values were studied (Table 4). CRP showed a weak positive correlation for PCT value <0.5ng/ml and 0.5-2ng/ml. For PCT values between 2-10ng/ml, >10ng/ml CRP showed statistically significant correlation with p value <0.05 & <0.00001 respectively. Whereas correlation of TLC with PCT was poor and statistically not significance.
|
PCT (ng/ml) |
No. of Samples |
CT (ng/ml) Mean ± SD |
CRP (mg/l) Mean ± SD |
TLC (cells/cu mm) Mean ± SD |
|
<0.5 |
55 |
0.23 ± 0.13 |
11.23 ± 5.63 |
10259.47 ± 4698.15 |
|
0.5‑1.9 |
43 |
1.11 ± 0.46 |
13.1 ± 6.58 |
12479.53 ± 6760.65 |
|
2‑10 |
43 |
4.83 ± 2.42 |
14.09 ± 7.3 |
14390.23 ± 6052.22 |
|
>10 |
49 |
43.89 ± 30.4 |
21.3 ± 12.89 |
12504.55 ± 7078.73 |
|
PCT |
|
CRP |
TLC |
|
>0.5 |
Correlation coefficient |
-0.14583 |
-0.00829 |
|
P value |
0.290857 |
0.551734 |
|
|
0.5-2 |
Correlation coefficient |
0.06641 |
-0.1087 |
|
P value |
0.672258 |
0.4906 |
|
|
2-10 |
Correlation coefficient |
0.31985 |
0.1571 |
|
P value |
0.036571 |
0.314376 |
|
|
>10 |
Correlation coefficient |
0.64044 |
-0.1521 |
|
P value |
0.00001 |
0.297131 |
|
|
Overall |
Correlation coefficient |
0.252 |
-0.021 |
|
P value |
0.001 |
0.7748 |
Procalcitonin is used as a diagnostic marker for diagnosing various clinical conditions and as a prognostic marker to indicate the severity of bacterial sepsis. PCT clearance has been used as an indicator to assess recovery of patient from sepsis. 13 In the present study mean age of the study population was 53.45 years, about 22.63% of patients had PCT in the range of 0.5 and 1.9 ng/ml, 22.63% had 2–10 ng/ml, and 25.78% had >10 ng/ml. Similar distribution was observed in other studies done around the world. A study from United States reported a higher incidence of sepsis in patients aged above 57 years. 15 The mean age in an epidemiological study of severe sepsis in India was 58.17 years. 16
In the present study, 106 (55.79%) patients had positive culture and 84 (44.21%) had sterile culture with p < 0.05. Of the 106 culture-positive samples 54.21% were Escherichia coli, 19.28% were Klebsiella pneumoniae and 6.02% Pseudomonas aeruginosa. In our study PCT levels were high (15.9 ± 25.12) in Gram-negative organisms compared to (11 ± 24.65) Gram-positive organisms but the difference is not statistically significant. The mean CRP and TLC level were not significantly different among the organisms. Similar to the present study, Tanrıverdi et al. concluded that PCT was better than CRP for predicting bacterial infections in patients with acute exacerbation of chronic obstructive pulmonary disease. 17 In contrast to our study Titova et al. repoted that the PCT had about the same accuracy as CRP and WBC in predicting pneumonia in patients hospitalized with acute exacerbations of chronic obstructive pulmonary disease. 18
In this study patients with septic shock showed PCT & CRP levels higher than patients with sepsis, the difference was statistically significant (p<0.0001). Lipinska-Gediga et al. also have reported similar results. 19 Another study from Maharashtra reported that PCT was significantly correlated with the severity of sepsis than CRP. 20 Nargis et al. quoted that the serum PCT and CRP values in cases with sepsis, severe sepsis and septic shock were significantly higher (P < 0.01) and PCT was found to be superior to CRP in the identification and to assess the severity of sepsis. 21
The coefficient of correlation of CRP and TLC with reference to PCT values for prediction of likelihood of sepsis was done. CRP showed positive correlation with PCT & it was found to be statistically significant in patients with sepsis, septic shock with p value <0.05 & <0.00001 respectively. Whereas TLC showed weak negative correlation with PCT that was statistically insignificant. Our results indicated that CRP along with PCT are better predictors of sepsis and septic shock. 22 Similar to our study Menka et al concluded that CRP and PCT are mere predictors of sepsis with no correlation with WBC counts. 23
Limitations of the present study was lower sample size and retrospective analysis. Another important limitation was biomarkers like persepsin and lactate level were not done in the present study. To Conclude procalcitonin along with CRP is a better diagnostic tool for sepsis but their correlation in context to TLC was poor. Due to lack of an ideal isolated marker, our study mandates using combination of biomarkers for diagnosis of sepsis.
Subscribe now for latest articles and news.