Journal of Medical Sciences and Health
DOI: 10.46347/jmsh.2015.v01i03.003
Year: 2015, Volume: 1, Issue: 3, Pages: 10-13
Original Article
Pushpa Sarkar1, S K Mahadeva2, H Raghunath3, V Nimisha4, T Sibi Mandela4
1Professor, Department of Biochemistry, Mandya Institute of Medical Sciences, Mandya, Karnataka, India,
2Associate Professor, Department of Biochemistry, Mandya Institute of Medical Sciences, Mandya, Karnataka, India,
3Assistant Professor, Department of Biochemistry, Mandya Institute of Medical Sciences, Mandya, Karnataka, India,
4Postgraduate, Department of Biochemistry, Mandya Institute of Medical Sciences, Mandya, Karnataka, India
Address for correspondence:
Dr. H Raghunath, Department of Biochemistry, Mandya Institute of Medical Sciences, Mandya - 571 401, Karnataka, India. Phone: +91-9632288911. E-mail: [email protected]
Background and Aim: It is a well-known fact that many health indices have a relationship with anthropometric indices. With this in mind, the correlation of dyslipidemia with anthropometric indices was done to bring to light the best anthropometric index in predicting the same.
Materials and Methods: A retrospective analysis of the data obtained from The Community Outreach Program (COP) at Holalu village conducted by the Department of Biochemistry, Mandya Institute of Medical Sciences Mandya was done. 460 participants above the age of 30 years, both males and females were a part of this COP. During the COP, physical measurements such as height, weight, waist circumference (WC), hip circumference (HC) were measured and various biochemical parameters such as total cholesterol, triglycerides, high-density lipoprotein and low-density lipoproteins were investigated. Anthropometric indices such as body mass index (BMI), waist hip ratio, WC, and waist height ratio were calculated from the data. The data analysis was done using statistical software Epi data analysis V.2.2.2.178.
Results: Regression analysis and receiver operating characteristic analysis was done to determine the best anthropometric index. Of all the anthropometric indices, the area under the curve of BMI was the highest for most of the lipid profile parameters (0.6 and above). Regression analysis showed BMI as the best anthropometric index for dyslipidemia (0.078). In this study, we found that BMI is the single best anthropometric index for predicting dyslipidemia.
Conclusion: Anthropometric indices can be used to predict dyslipidemia which in turn can be used as a predictor of cardiovascular diseases. BMI can be considered as a better tool to determine dyslipidemia compared to other anthropometric indices.
KEY WORDS:Anthropometric indices, body mass index, dyslipidemia, waist circumference, waist height ratio, waist hip ratio.
IntroductionObesity is considered to be one of the main causes of metabolic syndrome which comprises the following components namely dyslipidemia, hypertension, and increased insulin resistance in addition to other components. These entities are in turn known to cause cardiovascular disease (CVD) and Type2 diabetes mellitus.[1] The World Health Organization recognizes obesity as a global epidemic[2] and overweight and obesity are said to be the 5th leading risk factors for deaths across the globe.[3] It is seen that Indians have considerably higher prevalence of premature coronary artery disease (CAD) and standardized mortality rates for CAD compared with Europeans, Chinese, and Malays.[4-6] It has also been predicted that in the next 20 years there will be a dramatic increase in the prevalence of CAD due to rapid changes in demography and lifestyle consequent to economic development.[7,8] Hence, it makes it necessary to find a simple and reliable tool to measure the risk factors of CVD. Lipid profile is considered as one of the most important method to determine risk of developing CVD. However, measuring lipid profile is an invasive method, and hence an alternative noninvasive procedure could be used to assess the risk of CVD at the community level. Anthropometric indices fit into this picture of being the simplest method. It gives a fair measurement of fat cell mass and are the best predictors of medical complications of obesity. They include body mass index (BMI), waist circumference (WC), waist hip ratio (WHR), and waist height ratio (WHtR). WC, WHR, WHtR, and BMI have been used to assess body fat distribution and abdominal obesity.[9,10] Considerable debate still exists in the literature as to which of the anthropometric indices is superior for predicting dyslipidemia and in turn cardiovascular and diabetic risks. BMI is the recommended index of adiposity for epidemiological studies, as well as clinical practice.[11] However, some studies have shown that WC and WHR are a good measure of metabolically active intra-abdominal fat that is associated with insulin resistance, hypertension, and atherogenic dyslipidemia. Certain other studies indicate WHtR as the best screening tool for dyslipidemia compared to WHR, WC, or BMI. However, confusion still exists as to which anthropometric index best predicts dyslipidemia. This makes it essential to determine which of the anthropometric indices can be used to identify dyslipidemia which is one of the most important risk factor for metabolic syndrome and CVD. Objectives The objectives of the study were to determine the correlation between various anthropometric indices and dyslipidemia and to determine the best anthropometric index or indices for predicting dyslipidemia among the population at Holalu village. MATERIALS AND METHODSSubjects The data obtained from The Community Outreach program (COP) were analyzed. The data consisted of physical measurements and biochemical investigations of 460 individuals of Holalu village in Karnataka. The incomplete data pertaining to 12 participants data were omitted from the study. Hence, the data of 448 participants was analyzed among whom 219 were males and 229females above the age of 30 years. Permission to conduct this study was obtained from the Ethical Committee of our Institution. Informed consent to use the data generated from the COP for scientific purpose was obtained from all the subjects who participated in the study during the time of COP. Anthropometry At the COP, the following physical measurements were recorded by the observer that is body weight, height, WC, and HC. The participants were weighed on the calibrated weighing scale barefooted, and height was measured barefooted with head in horizontal plane to the nearest 0.5 cm. WC (midway between the lower rib margin and the iliac crest at the end of normal expiration) and HC (widest diameter over the greater trochanter) were measured to the nearest 0.1 cm in standing position using a measuring tape. BMI was calculated as weight (kg) divided by height in meter square (m2). WHR and WHtR were calculated by dividing the respective measurements. According to WHO guidelines, the appropriate cut-off values of BMI, to predict the presence of multiple metabolic risk factors were 22.85 and 23.30 kg/m2 in males and females, respectively. Those of WC, WHR, and WHtR were 91.3 cm and 87.1 cm, 0.9 and 0.85, and 0.51 and 0.53 in males and females, respectively.[12] During the COP, 5 ml of overnight fasting venous blood samples (8-12 h of overnight fasting) were obtained from each participant under aseptic precautions using vacutainers with no added anticoagulant and the serum was separated within 1 h. These fasting venous blood samples were tested for total cholesterol, triglycerides (Tg), high- density lipoprotein. Low-density lipoprotein was calculated using friedewald formula for samples with Tg < 400 mg/dl. The reference range of lipid profile was taken from ATP III Criteria.[13] Statistical analysis The collected data were entered in excel sheet and analyzed using Epi-data analysis V.2.2.2.178. Regression analysis and receiving operating curve (ROC) were the statistical methods used to compare anthropometric indices to predict dyslipidemia. Area under the curve (AUC) was used to evaluate the overall performance of each ROC curve, which is a measure to identify subjects with risk factors. |
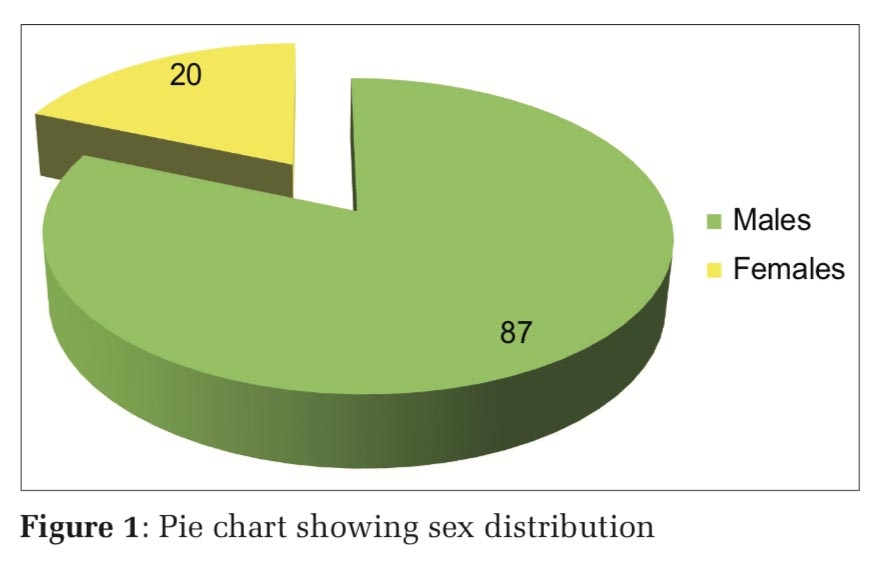
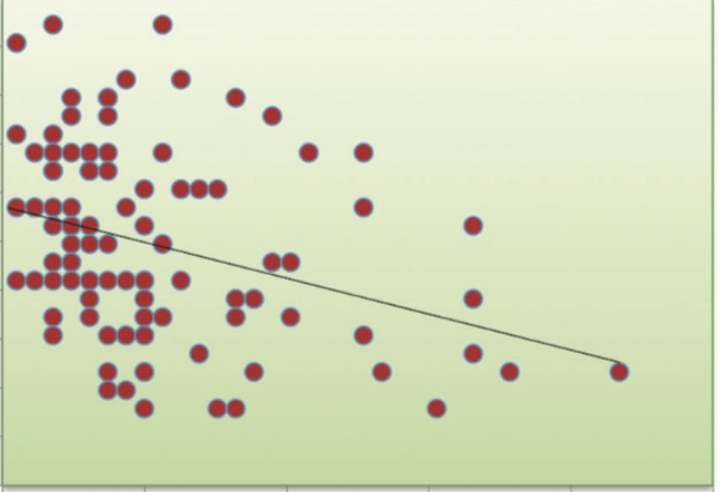
Results and DiscussionThe data obtained from the COP were analyzed which consisted of 448 participants from the local population at Holalu village of which 219 (48%) were males and 229(52%) were females. Both regression analysis and ROC analysis was done to correlate the individual anthropometric indices and lipid profile parameters. The regression analysis of various anthropometric indices is shown in Table 1. The AUC of anthropometric indices is shown in Table 2. From the above tables of regression analysis and ROC analysis, AUC of BMI was the highest for most of the lipid profile parameters (0.6 and above). Regression analysis showed BMI as the best anthropometric index for dyslipidemia (0.078). Hence, BMI can be considered as the single best anthropometric index to predict dyslipidemia.
|
ConclusionAnthropometric indices are non-invasive and simple predictors of medical complications of obesity and dyslipidemia. These indices have been used over the invasive techniques of blood investigations to provide medical and public health practitioners a tool to bring out high risk individuals of dyslipidemia and its complications and hence reduce the burden of chronic disease at a later stage. In rural community setups where there is limited access to the laboratory and the quality control system has not been put to use effectively, measurement of anthropometric indices as a tool to predict dyslipidemia plays a major role. This early screening method of measuring anthropometric indices plays a vital role in the long run to avoid dyslipidemia and its complications at later stages in life by implementing dietary and lifestyle changes. The various studies conducted have given different conclusions about which anthropometric measurement has the best predictive value for dyslipidemia. It has been shown that age is an important factor that modifies the ability to discriminate various anthropometric indices in identifying subjects with dyslipidemia. Diverse ethnic and geographic populations also affect the anthropometric measurements in the prediction of risk factors.[14-16] Therefore keeping in mind the above fact, it is suggested that using anthropometric indices for screening needs specific studies in different age groups and in populations of varied ethnic backgrounds. Our present study indicated that BMI was the best anthropometric index among others to predict dyslipidemia.
Further ResearchBMI may be the best screening tool to predict dyslipidemia which is one of the risk factors for CVD but such a conclusion always needs further studies and verifications in longitudinal epidemiological studies on morbidity and mortality. |
Subscribe now for latest articles and news.