Journal of Medical Sciences and Health
DOI: 10.46347/jmsh.2021.v07i03.020
Year: 2021, Volume: 7, Issue: 3, Pages: 97-101
Original Article
B G Vittal1 , Mahantesh Patil2 , D Abhijith3
1 Professor and HOD, Department of Biochemistry, Hassan Institute of Medical Sciences, Hassan, Karnataka, India
2 Associate Professor, Department of Biochemistry, Mysore Medical College & Research Institute, Mysore, Karnataka, India
3 Senior Resident, Department of Biochemistry, JSS Medical College, Mysore, Karnataka, India
Address for correspondence:
B G Vittal, Professor and HOD, Department of Biochemistry, Hassan Institute of Medical Sciences, Hassan, Karnataka, India. Email: [email protected]
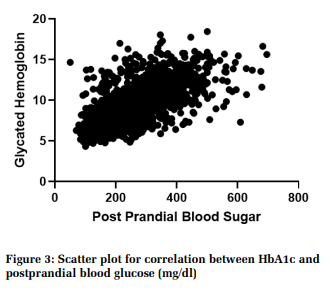
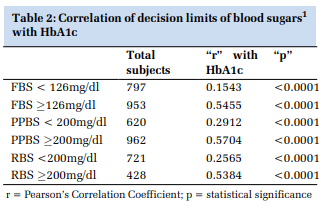
Background: Blood glucose estimation has been the mainstay of diabetes diagnosis, monitoring and treatment over years until the emergence of Glycated haemoglobin (HbA1c), a new benchmark. However, the cost has prevented the use of HbA1c in small laboratory settings. Data from previous studies yielded ambiguous results about the correlation of HbA1c with blood sugars. Objective: To check for correlation between HbA1c with fasting blood sugar (FBS), postprandial blood sugar (PPBS) and random blood sugar (RBS) and to assess usefulness of blood glucose in monitoring the glycemic control in diabetic patients. Methodology : Retrospective one-year data of diabetic patients who were investigated for HbA1c, FBS, PPBS and RBS was obtained. Data was analysed to find correlation between HbA1c and blood sugars. Pearson’s Correlation coefficient was also used to find correlation of different decision limits of blood sugars with HbA1c. Results: Significant correlation was observed between RBS, FBS and PPBS and HbA1c with Pearson’s Correlation coefficients (r) 0.7005, 0.6903 and 0.6881. Blood glucose levels in diabetic range correlated better than non-diabetic glucose levels with HbA1c. Conclusion: FBS, PPBS and RBS do not have higher clinical utility over each other in predicting long-term glycemic control. Blood glucose levels higher than clinical decision limits have a high-reliability index of predicting poor long-term glycemic control.
|
Background: Blood glucose estimation has been the mainstay of diabetes diagnosis, monitoring and treatment over years until the emergence of Glycated haemoglobin (HbA1c), a new benchmark. However, the cost has prevented the use of HbA1c in small laboratory settings. Data from previous studies yielded ambiguous results about the correlation of HbA1c with blood sugars. Objective: To check for correlation between HbA1c with fasting blood sugar (FBS), postprandial blood sugar (PPBS) and random blood sugar (RBS) and to assess usefulness of blood glucose in monitoring the glycemic control in diabetic patients. Methodology : Retrospective one-year data of diabetic patients who were investigated for HbA1c, FBS, PPBS and RBS was obtained. Data was analysed to find correlation between HbA1c and blood sugars. Pearson’s Correlation coefficient was also used to find correlation of different decision limits of blood sugars with HbA1c. Results: Significant correlation was observed between RBS, FBS and PPBS and HbA1c with Pearson’s Correlation coefficients (r) 0.7005, 0.6903 and 0.6881. Blood glucose levels in diabetic range correlated better than non-diabetic glucose levels with HbA1c. Conclusion: FBS, PPBS and RBS do not have higher clinical utility over each other in predicting long-term glycemic control. Blood glucose levels higher than clinical decision limits have a high-reliability index of predicting poor long-term glycemic control. |
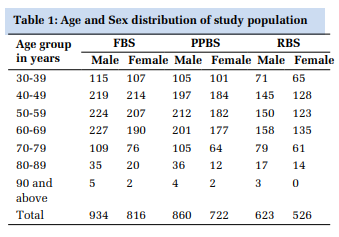
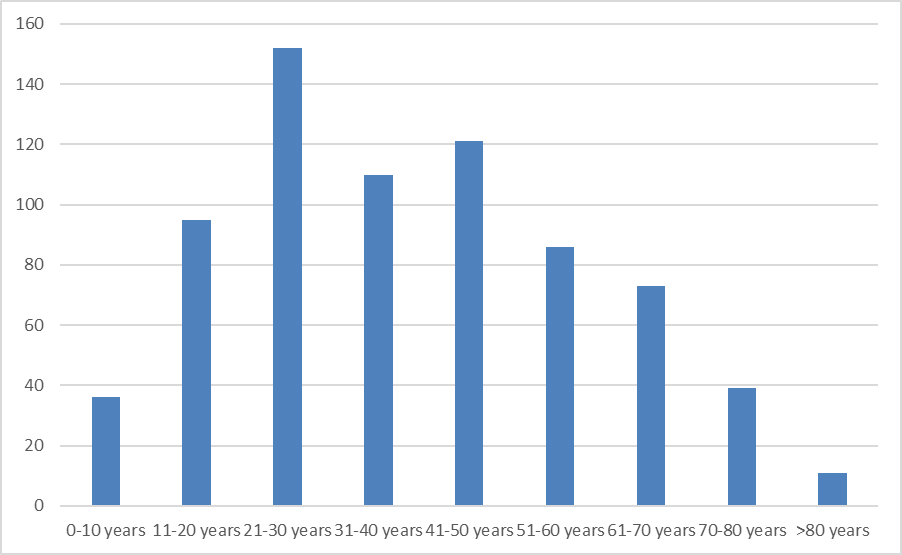
IntroductionGlycaemic control is the cornerstone in the management of diabetes mellitus, and good glycaemic control reduces morbidity and mortality of the diseases.[1,2] Hyperglycaemia in diabetic patients is associated with damage, dysfunction, and failure of kidneys, nerves, heart, eyes and vasculature.[3] Landmark randomized clinical trials and observational studies on diabetic patients have inferred that achieving strict glycemic control significantly decreases the microvascular and macrovascular complications of the disease.[4,5] glycaemic control of diabetics can be assessed by measurement of glycated haemoglobin (HbA1c), fasting plasma glucose (FPG), and postprandial plasma glucose (PPG). MethodologySource of dataA retrospective cross-sectional study was conducted from data obtained from two tertiary care centres of Karnataka, India. Hassan Institute of Medical Sciences, Hassan (HIMS, Hassan) and Mysore Medical College and Research Institute, Mysore (MMCRI, Mysore) were the study centres. Institution Ethics Committee permission was obtained before the start of the study. Sample sizeSample size was calculated by using formula n = Z2 x PQ /d2 , where Z = 3.891 at 99.99% confidence, p = Prevalence and q = 1-p and d = allowable error. (sample size of 491 was calculated by keeping 8.9% prevalence of diabetes mellitus and allowable error of 5%) (19). One year data which was well above the statistically required sample size was considered for our study. Study procedureRetrospective one-year data (from April 2019 to March 2020) of subjects who were investigated for Glycated haemoglobin (HbA1c) was obtained. Their laboratory investigation data on fasting serum glucose, postprandial serum glucose and random serum glucose was obtained. Their clinical data on diabetic status was also obtained from records. The patient data which met the inclusion criteria was included and data of patients that met exclusion criteria was excluded. From the laboratory records, it was ensured that standard internal and external quality control practices were in place during the entire period of the study. Both study centres used similar laboratory methods to ensure uniformity. Fasting, postprandial and random blood glucose was estimated in serum using hexokinase method. HbA1c was estimated using enzymatic method traceable to NGSP. At HIMS, Hassan tests were performed using Abbott Architect ci4100 integrated analyser and at MMCRI, Mysore tests were performed by Roche Cobas 6000 analyser with their reagents. ResultsData of 6514 diabetic subjects who had undergone HbA1c investigation and met inclusion and exclusion criteria was obtained. Out of these subjects 1750 patients were investigated with FBS, 1582 patients were investigated with PPBS, and 1149 patients were investigated with RBS investigations. Age and sex distribution are illustrated in Table 1. DiscussionBlood glucose estimation had been the mainstay of diabetes diagnosis, monitoring and treatment over years until the emergence of HbA1c. Over the last few decades, HbA1c has assumed its importance as the benchmark in the management of diabetes. However, the cost and technical sophistication of investigative equipment have prevented its widespread use in small and very small clinical or laboratory settings. It has led to speculation of whether traditional fasting, postprandial and random blood sugar estimation can be a substitute during lack of HbA1c. Limitations of the studyBy design, present study was retrospective and could not include patients’ full clinical details. Further prospective studies with clinical correlations can add more value. ConclusionAlthough FBS, PPBS and RBS correlate significantly with HbA1c, none of them seem to have higher clinical utility over the other in predicting long-term glycemic control. AcknowledgementsMr Mahesh Dhumale and Mr Vinayak of Pathoplus - Laboratory Information Systems.
|
Subscribe now for latest articles and news.