Journal of Medical Sciences and Health
DOI: 10.46347/jmsh.v11.i3.25.140
Year: 2025, Volume: 11, Issue: 3, Pages: 288-296
Original Article
Olusoji Adebusoye Oyesola1 , Oluwaseye Emmanuel Olayemi1 , Temitope Esther Ogungbenle1 , Solomon Olawale Adebanjo1 , Olaniyi Azeez Soetan1 , Eunice Ojo-Adebayo1
1Department of Physiology, Faculty of Basic Medical Sciences, Olabisi Onabanjo University, Ogun State, Nigeria
Address for correspondence: Oluwaseye Emmanuel Olayemi, Department of Physiology, Faculty of Basic Medical Sciences, Olabisi Onabanjo University, Ogun State, Nigeria.
E-mail: [email protected]
Received Date:22 April 2025, Accepted Date:14 June 2025, Published Date:14 November 2025
Background: Diabetes mellitus is a metabolic disorder with systemic consequences, including neurodegenerative effects on the hypothalamus—an essential regulator of appetite, energy balance, and hormonal homeostasis. This study investigated the therapeutic potential of glibenclamide, catechin, and ethanolic neem leaf extract (ENLE) on hypothalamic integrity, inflammation, oxidative stress, hormonal regulation, and feeding behavior in alloxan-induced diabetic rats.
Methods: Thirty-five male Sprague-Dawley rats were divided into five groups: normal control group A, diabetic group B, glibenclamide-treated group C, catechin-treated group D, and ENLE-treated group E. Diabetes was induced via intraperitoneal injection of alloxan (150 mg/kg bw), and animals with blood glucose >200 mg/dL were considered diabetic.
Results: Diabetic rats exhibited hyperglycemia, increased food intake, elevated ghrelin, reduced leptin, heightened oxidative stress, and inflammation in the hypothalamus, evidenced by increased malondialdehyde (MDA), NF-κB, and IL-6, alongside diminished antioxidant enzymes (GSH, SOD, CAT) and morphological degeneration. Treatment with glibenclamide, catechin, and ENLE significantly improved glycemic control, feeding pattern, oxidative and inflammatory profiles, and restored hypothalamic histoarchitecture. ENLE showed the most pronounced effect, normalizing ghrelin and leptin levels and preserving neuronal integrity.
Conclusion: These findings highlight the hypothalamus as a critical target in diabetes pathophysiology and suggest that phytochemicals like catechin and ENLE may offer neuroendocrine benefits beyond glycemic regulation. ENLE’s superior efficacy suggests its potential as an adjunctive therapy for managing neuroendocrine complications of diabetes, particularly in resource-limited settings.
Diabetes mellitus (DM) is a chronic metabolic disorder characterized by hyperglycemia resulting from defects in insulin secretion, insulin action, or both. Beyond its classical metabolic consequences, DM also disrupts central nervous system (CNS) functions, particularly those governed by the hypothalamus, a key regulatory center for energy homeostasis and feeding behavior 1. In both type 1 and type 2 diabetes, hypothalamic dysfunction contributes significantly to altered appetite regulation, satiety signaling, and energy expenditure, often manifesting as hyperphagia or anorexia depending on disease stage and severity 2.
Alloxan, a β-cell cytotoxin, is commonly used to induce type 1-like diabetes in experimental models. It selectively accumulates in pancreatic β-cells via the GLUT2 transporter, generating reactive oxygen species (ROS) that lead to oxidative stress, DNA damage, and cell death 3. While much of the focus in diabetes research centers around peripheral complications, emerging evidence highlights that hyperglycemia also impairs hypothalamic signaling by disrupting insulin and leptin pathways, altering the expression of neuropeptides such as neuropeptide Y (NPY), pro-opiomelanocortin (POMC), and agouti-related peptide (AgRP) 4.
Therapeutic strategies that modulate central signaling and restore metabolic balance are of growing interest. Glibenclamide, a sulfonylurea class antidiabetic, stimulates insulin secretion by closing ATP-sensitive K⁺ channels in β-cells, but its impact on hypothalamic regulation is less explored 5. Catechin, a flavonoid polyphenol found in green tea, exhibits neuroprotective and appetite-modulating effects, largely attributed to its antioxidant and anti-inflammatory properties 6. Azadirachta indica, a medicinal plant widely used in traditional medicine, has demonstrated antidiabetic, neuroprotective, and anti-obesity effects in various models. Neem’s bioactive compounds, including nimbolide and quercetin, have shown promise in modulating insulin signaling and reducing neuroinflammation 7, 8.
This study aims to comparatively evaluate the effects of glibenclamide, catechin, and ethanolic neem leaf extract on hypothalamic integrity and feeding behavior in alloxan-induced diabetic rats. By assessing food intake patterns, hypothalamic neuropeptide expression, and relevant biochemical markers of oxidative stress and inflammation, this research seeks to elucidate the neuroendocrine mechanisms underlying appetite dysregulation in diabetes and the potential for pharmacological and phytotherapeutic modulation.
Thirty-five mature male Sprague-Dawley rats, seven weeks old were utilized for this study. The rats were given unrestricted access to food and water and were housed in plastic cages under typical laboratory settings. Ethical approval for the use of animal for research was obtained from Olabisi Onabanjo University Teaching Hospital Human Research Ethics Committee (OOUTH-HREC) with the number OOUTH/HREC/010//026/E120/2024AP. Strict adherence was made to all criteria regarding the use and care of laboratory animals. After the induction of diabetes, the animals were weighted and randomly assigned to groups followed by treatment for a period of 14 days as showed in Table 1.
|
Group |
Treatment |
References |
|
|
A |
Normal control |
Distilled water only |
|
|
B |
Diabetes control |
Alloxan (150 mg/kg bw) i.p |
Yakubu et al., 9 |
|
C |
Glibenclamide treatment group |
Alloxan (150 mg/kg bw) i.p + glibenclamide (5mg/kg bw) p.o |
Shah & Khan, 10 |
|
D |
Catechin treatment group |
Alloxan (150 mg/kg bw) i.p + CTN (40mg/kg bw) p.o |
Nazir et al., 11 |
|
E |
Ethanolic neem leaf extract (ENLE) treatment group |
Alloxan (150 mg/kg bw) i.p + ethanolic neem leave extract (250mg/kg bw) p.o |
Dholi et al., 12 |
p.o = per oral, i.p = intraperitoneal, bw = body weight
Neem leaves were collected from Sagamu. The leaves were identified at the Department of Pharmacognosy, Olabisi Onabanjo University. The leaves were air dried in the Physiology laboratory for two weeks and were crushed using mechanical grinder.
The extraction was carried out according to the method of Nazir et al., 13 using 100g of the leave powder dissolved in 500ml of 99% ethanol for 3 days kept in the refrigerator with periodic shaking. The resulting mixture was then filtered using muslin cloth followed by whatman filter paper. The filtrate was concentrated into a semisolid mass at 40 °C under reduced pressure in the rotary evaporator. The concentrate was reconstituted in 70% ethanol to prepare the dose to be used for the study.
The induction of diabetes was done according to the method described by Yakubu et al., 9. Stock solution of alloxan monohydrate was prepare by dissolving alloxan monohydrate (0.9 g) in 3 ml of distilled water to give a stock concentration of approximately 150 mg/ 0.5 ml. Diabetes was induced by single i.p administration of alloxan monohydrate (150 mg/kg body weight). The rats with blood glucose level greater than 200 mg/dl, 72 hours post-induction, was considered diabetic and used for this research work.
10 mg glibenclamide tablet was crushed and dissolved in 5 ml of distilled water to give a concentration of 2 mg/ml. 5 mg/kg body weight dose of glibenclamide was administered from the stocked solution according to Shah & Khan, 10.
160 mg catechin was dissolved in 10 ml of distilled water to give a concentration of 8 mg/ 0.5 ml. 40 mg/kg body weight dose of catechin was administered from the stocked solution according to Nazir et al., 11.
4.9 g of neem leaf was dissolved in 49 ml of 70% ethanol to give a concentration of 50 mg/ 0.5 ml. 250 mg/kg body weight dose of ENLE was administered from the stocked solution according to Dholi et al., 12.
Fasting blood glucose was determined with a drop of blood from the rat tail using a glucometer (Accu-Check, Roche, Germany), after an overnight fast of 14 hours every 48 hours.
Blood was collected from the orbital venous sinus, the rats were restrained with a towel, the neck gently scuffed, and the eye made to bulge. Heparinized capillary tube was inserted dorsally into the eye and blood was allowed to flow by capillary action through the capillary tube into sample bottle.
To assess feeding behavior, the daily feed intake of each rat was monitored throughout the experimental period. The animals were housed in a metabolic cage to allow for accurate measurement of food consumption. A pre-weighed amount of standard rat feed pellets (200 g) was administered to each group daily, at approximately the same time each morning to maintain consistency in feeding schedule and minimize circadian variation. After 24 hours, the remaining feed (leftover) was carefully collected and weighed using an electronic digital balance (Mettler Toledo ME204). The amount of food consumed was calculated by subtracting the weight of the leftover feed from the original 200 g supplied:
Daily feed intake (g) = Feed offered – Feed remaining
This measurement was repeated every day for each animal group, and the average daily feed intake over the study period was computed for each treatment group. All measurements were conducted under standardized conditions to minimize stress and environmental variation, which could affect feeding behavior.
The animals were sacrificed by cervical dislocation after the expiration of research. The organs of study were harvested following midline abdominal incision, the organs weight was determined using a weighing scale.
Approximately 0.1 g of hypothalamic tissue was excised and immediately washed with ice-cold saline to remove blood residues. The tissues were then homogenized in 4 mL of phosphate buffer solution (PBS; 0.1 M, pH 7.2). The homogenates were centrifuged at 3,000 rpm for 10 minutes at 4°C using a refrigerated centrifuge (Thermo Scientific™ Heraeus™ Megafuge™ 16R, USA). The resulting supernatants were aliquoted and stored at –80°C until further analysis.
GSH levels were determined using the Cayman Chemical Glutathione Assay Kit (Cat. No. 703002, USA), based on the reaction of GSH with DTNB (5,5′-dithiobis-(2-nitrobenzoic acid)) forming a yellow-colored product measurable at 405 nm. Absorbance was read using a microplate reader (BioTek Epoch™, USA).
SOD activity was assayed using the Cayman Chemical Superoxide Dismutase Assay Kit (Cat. No. 706002). This method employs xanthine oxidase to generate superoxide radicals, which then react with a tetrazolium salt. SOD inhibits this reaction, and activity is inversely proportional to absorbance at 450 nm.
Catalase activity was measured with the Cayman Chemical Catalase Assay Kit (Cat. No. 707002). This kit uses the peroxidatic function of catalase to react with methanol in the presence of H₂O₂, forming formaldehyde, which is colorimetrically detected at 540 nm.
TAC was determined using the Abcam Total Antioxidant Capacity Assay Kit (AB65329, UK). This kit measures antioxidant capacity via the reduction of Cu²⁺ to Cu⁺ by antioxidants present in the sample, with absorbance measured at 570 nm.
Total protein concentration was quantified using the Bradford Protein Assay Kit (Bio-Rad, Cat. No. 5000006). The assay is based on the binding of Coomassie Brilliant Blue G-250 to proteins, forming a complex detectable at 595 nm.
MDA levels, an index of lipid peroxidation, were measured using the TBARS Assay Kit (Cayman Chemical, Cat. No. 10009055). This assay detects the MDA-TBA adduct, with absorbance read at 532 nm.
Levels of NF-κB in hypothalamic tissue were quantified using a Rat NF-κB p65 ELISA Kit (Elabscience®, Cat. No. E-EL-R0676, USA). The assay is based on the sandwich ELISA principle using pre-coated 96-well plates with an NF-κB-specific capture antibody. After adding standards and samples, a biotinylated detection antibody was applied, followed by HRP-conjugated streptavidin and TMB substrate. Absorbance was measured at 450 nm using a microplate spectrophotometer (BioTek Epoch™, Agilent Technologies, USA). Concentrations were calculated against a standard curve.
Hypothalamic IL-6 concentrations were determined using a Rat IL-6 ELISA Kit (Elabscience®, Cat. No. E-EL-R0015, USA). Following the manufacturer's protocol, standards and samples were incubated in wells pre-coated with a rat IL-6 monoclonal antibody. Detection was performed using biotin-conjugated antibodies and HRP-streptavidin, followed by TMB substrate development. The reaction was terminated with stop solution, and absorbance was recorded at 450 nm. Values were derived from a standard curve.
Serum levels of ghrelin and leptin were quantified using commercially available enzyme-linked immunosorbent assay (ELISA) kits according to the manufacturer’s protocols. Blood samples were collected from experimental animals via orbital sinus at the end of the treatment period. The collected blood was allowed to clot at room temperature and then centrifuged at 3,000 rpm for 15 minutes at 4°C. The serum obtained was aliquoted and stored at –80°C until analysis. Total ghrelin concentration was measured using a rat-specific Total Ghrelin ELISA kit (Elabscience, Cat. No. E-EL-R0057, Houston, TX, USA), and leptin levels were assessed using a rat Leptin ELISA kit (CUSABIO, Cat. No. CSB-E07435r, Wuhan, China). All reagents, standards, and samples were brought to room temperature prior to use. Standards and samples were pipetted into the appropriate wells of the 96-well microtiter plates coated with specific antibodies. The plates were incubated with biotinylated detection antibodies, followed by horseradish peroxidase (HRP)-conjugated streptavidin. After washing to remove unbound components, tetramethylbenzidine (TMB) substrate solution was added, and color development was allowed to proceed in the dark. The reaction was stopped using a sulfuric acid stop solution, and absorbance was measured at 450 nm using a microplate reader (BioTek Epoch™, USA). Concentrations of ghrelin and leptin in the samples were calculated based on the standard curves generated using known concentrations of each analyte. All measurements were performed in duplicate to ensure reliability and reproducibility of results.
For histological analysis, hypothalamic tissue samples were fixed in 10% neutral buffered formalin (NBF) for 24-48 hours, followed by dehydration in a series of ethanol solutions (70%, 80%, 90%, and 100%) and clearing in xylene. The tissues were then embedded in paraffin wax, sectioned into 5-μm thick slices using a microtome, and deparaffinized in xylene. The sections were rehydrated in a series of ethanol solutions, stained with Harris' hematoxylin solution for 5-10 minutes, and then stained with eosin Y solution for 1-2 minutes. After dehydration and clearing, the sections were mounted on glass slides using a mounting medium (DPX) and examined under a light microscope to observe tissue morphology and architecture.
All the values are expressed as mean ± standard error of mean (SEM). Analysis of data was done using Graph pad prism version 8 for windows. Differences between groups were analyzed by one-way anova followed by Bonferroni post-hoc test. Differences were considered significant when p < 0.05.
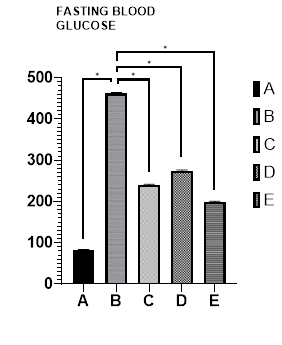
Figure 1 presents the effects of glibenclamide, catechin, and ENLE on glucose homeostasis in alloxan-induced diabetic rats.
The results revealed a significant increase in blood glucose levels in the diabetic group B (462±0.64) compared to the control group A (82±0.70). Conversely, treatment with glibenclamide (group C), catechin (group D), and ENLE (group E) resulted in a significant decrease in blood glucose levels (240±0.12, 275±0.73, and 199±0.71, respectively) compared to group B (462±0.64). All the values are expressed as mean ± standard error of mean (SEM).
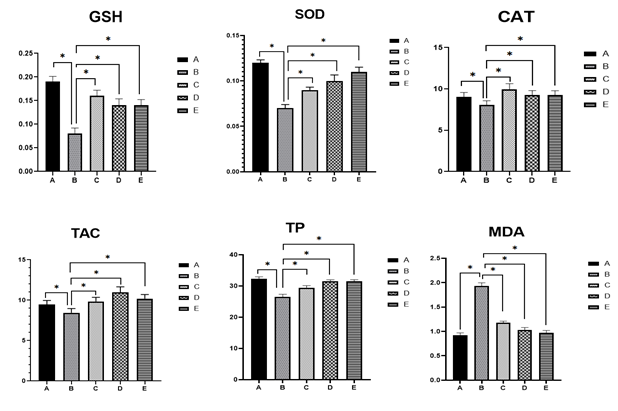
The results presented in Figure 2 demonstrate the effect of glibenclamide, catechin, and ENLE on hypothalamic tissue oxidative stress markers in alloxan-induced diabetic rat. A significant decrease in GSH activity (0.08±0.02), SOD activity (0.07±0.04), CAT activity (8.07±0.05), TAC (8.45±0.05) and TP level (26.89±0.09) was observed in the diabetic group (Group B) compared to the control group A (0.19±0.01, 0.12±0.03, 9.06±0.05, 9.45±0.05, 32.3±0.07, respectively). Conversely, treatment with glibenclamide, catechin, and ENLE (Groups C, D, and E, respectively) resulted in a significant increase in antioxidant enzyme activities GSH (0.16±0.02, 0.14±0.04, 0.13±0.02), SOD (0.09±0.03, 0.10±0.07, 0.11±0.05), CAT (9.93±0.07, 9.29±0.05, 9.28±0.05), TAC (9.83±0.05, 10.97±0.07, 10.19±0.05), and TP levels (29.46±0.07, 31.48±0.05, 31.49±0.05). Additionally, a significant decrease in MDA levels was noted in the treatment groups. All the values are expressed as mean ± standard error of mean (SEM).
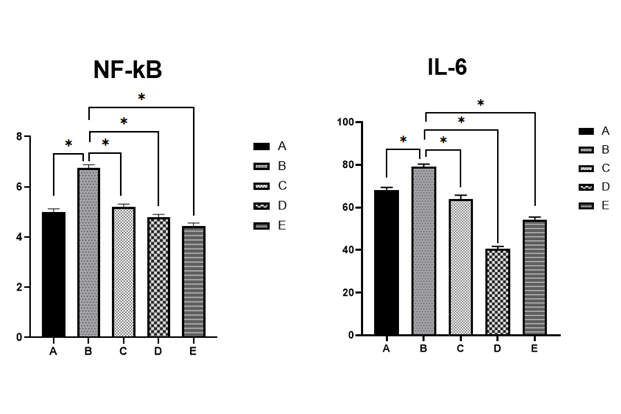
Figure 3 presents the effects of glibenclamide, catechin, and ENLE on hypothalamic inflammatory markers, specifically NF-κB and IL-6 in Alloxan-induced diabetic rat. The results indicate a significant increase in NF-κB (6.74±0.04) and IL-6 (79.02±0.02) levels in the diabetic group (Group B) compared to the control group A (5.00±0.02), (65.19±0.04) respectively. In contrast, treatment with glibenclamide, catechin, and ENLE (Groups C, D, and E, respectively) resulted in a significant decrease in NF-κB κB (5.19±0.02, 4.79±0.03, 4.44±0.02) and IL-6 (63.85±0.08, 40.49±0.02, 54.28±0.02) levels compared to Group B. All the values are expressed as mean ± standard error of mean (SEM).
|
Groups |
Ghrelin |
Leptin |
|
A |
1.20±0.20 |
2.70±0.30 |
|
B |
2.90±0.24* |
0.40±0.29* |
|
C |
1.72±0.31** |
1.60±0.24** |
|
D |
2.17±0.32** |
1.20±0.20** |
|
E |
1.58±0.24** |
1.90±0.24** |
* = p<0.05 when compared with group A ** = p<0.05 when compared with group B
Table 2 presents the effects of glibenclamide, catechin, and ENLE on ghrelin and leptin in Alloxan-induced diabetic rat. The results indicate a significant increase in ghrelin and decrease in leptin levels in the diabetic group (Group B) compared to the control group (Group A). In contrast, treatment with glibenclamide, catechin, and ENLE (Groups C, D, and E, respectively) resulted in a significant decrease in ghrelin and increase in leptin levels compared to Group B. All the values are expressed as mean ± standard error of mean (SEM).
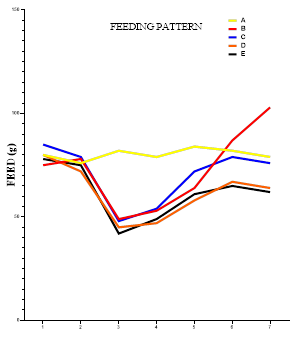
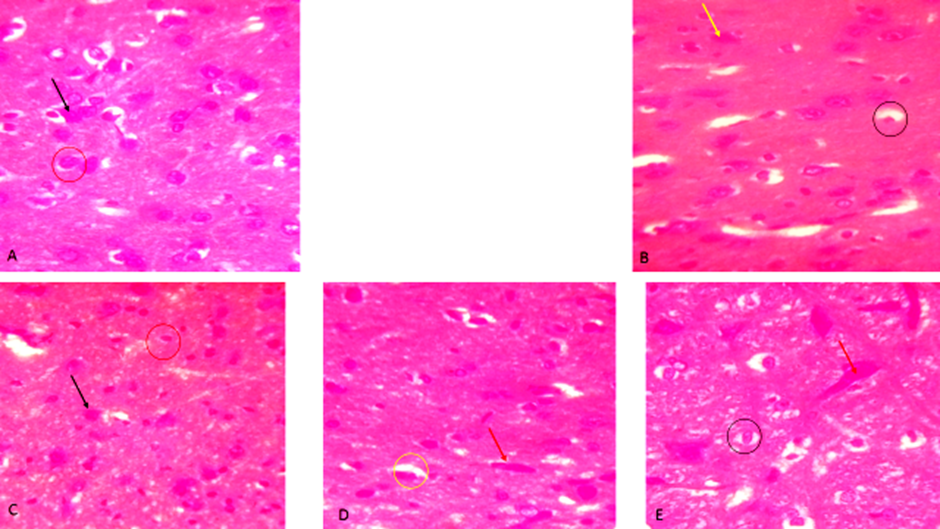
Figure 4 showed graph of bi-daily feeding pattern, a significant decline in feeding pattern followed by a significant increase was observed in group B (75, 78, 49, 53, 64, 87, 103) when compared with group A (80, 76, 82, 79, 84, 82, 79). In contrast, treatment with glibenclamide, catechin, and ENLE regulate the feeding pattern preventing excessive increase in food intake (85, 79, 48, 54, 72, 79, 76), (80, 72, 45, 47, 58, 67, 64), (78, 75, 42, 49, 61, 65, 62) compared to group B (75, 78, 49, 53, 64, 87, 103).
Diabetes mellitus is a systemic metabolic disorder that extends its pathological consequences beyond the pancreas to include central nervous system structures, notably the hypothalamus. The hypothalamus regulates energy balance, food intake, neuroendocrine function, and glucose metabolism through complex neuronal and hormonal networks. Diabetes disrupts this axis, triggering both biochemical and morphological damage to hypothalamic structures. This study investigates the restorative potential of glibenclamide, catechin, and ethanolic neem (Azadirachta indica) leaf extract on hypothalamic function, inflammation, oxidative stress, hormonal regulation, and feeding behavior in diabetic rats. The findings provide significant insights into the pathophysiological impacts of diabetes on the brain and the therapeutic implications of natural and synthetic agents.
As observed in Figure 1, alloxan-induced diabetic rats (Group B) displayed markedly elevated blood glucose levels (462±0.64 mg/dL) compared to the control (82±0.70 mg/dL), affirming the systemic diabetic state caused by β-cell cytotoxicity. Treatments with glibenclamide, catechin, and ENLE significantly lowered glucose levels, with neem (199±0.71 mg/dL) demonstrating the most pronounced effect. While glibenclamide acts through pancreatic K⁺-ATP channel inhibition to stimulate insulin release 5, catechin and neem likely exert hypoglycemic effects via antioxidant protection of β-cells and enhancement of peripheral glucose uptake 7, 14. Improved glycemic control helps stabilize central insulin signaling, which is essential for hypothalamic regulation of appetite and energy balance 15.
Oxidative stress is a major pathophysiological mechanism in diabetic neuropathy, including hypothalamic damage.
Figure 2 shows significant declines in the antioxidant enzymes GSH, SOD, and CAT in diabetic rats, along with decreased total antioxidant capacity (TAC) and total protein (TP), and increased malondialdehyde (MDA)—a marker of lipid peroxidation. This indicates severe oxidative damage in hypothalamic tissue. The treatment groups showed restoration of antioxidant defenses and reduction of MDA, suggesting a reversal of oxidative damage. Catechin and neem, both rich in polyphenols, are known to activate the Nrf2 antioxidant response pathway, thereby enhancing endogenous antioxidant enzyme expression 16. By protecting hypothalamic neurons from oxidative insult, these agents preserve neuronal integrity and functional connectivity essential for appetite regulation and metabolic control.
In diabetes, oxidative stress often coexists with neuroinflammation, especially in the hypothalamus, where inflammatory cytokines interfere with leptin and insulin signaling pathways. Figure 3 highlights elevated NF-κB and IL-6 levels in diabetic rats, reflecting heightened inflammatory activity. NF-κB is a transcription factor that amplifies pro-inflammatory cytokine production, while IL-6 exacerbates neuronal damage and leptin resistance 17.
Treatment with glibenclamide, catechin, and neem significantly reduced these inflammatory markers. Catechin and neem possess natural NF-κB inhibitory properties, thereby dampening the inflammatory response 18. Neem’s broad anti-inflammatory actions are attributed to compounds like nimbidin and azadirachtin, which have been shown to inhibit cytokine production and leukocyte infiltration 16. These effects are crucial in preserving hypothalamic neuron function and restoring hormonal sensitivity.
Diabetes disrupts central appetite regulation through imbalances in ghrelin (orexigenic hormone) and leptin (anorexigenic hormone). Table 2 demonstrates that diabetic rats exhibited elevated ghrelin and reduced leptin levels, correlating with increased hunger and altered feeding behavior. Ghrelin is known to be upregulated during energy deficiency, stimulating hypothalamic neuropeptide Y (NPY) and agouti-related peptide (AgRP) neurons to promote food intake 19. Conversely, leptin, secreted by adipocytes, inhibits these neurons and activates pro-opiomelanocortin (POMC) neurons to reduce appetite 20.
The treatment groups corrected these imbalances, suggesting restored hypothalamic sensitivity to peripheral hormonal cues. Neem’s normalization of leptin and ghrelin levels is particularly significant, as it reflects not only improved energy status but also repaired hypothalamic circuitry involved in satiety and hunger regulation.
Figure 4 presents the bi-daily feeding patterns. Diabetic rats exhibited an initial decline followed by a sharp increase in food intake, indicative of dysregulated hypothalamic signaling. Polyphagia, a classic symptom of uncontrolled diabetes, arises due to insulin and leptin resistance in the hypothalamus, failing to inhibit hunger-promoting pathways 2.
Treatments with glibenclamide, catechin, and ENLE moderated the hyperphagic response, maintaining food intake within a physiological range. This effect is consistent with improved leptin signaling, reduced ghrelin stimulation, and attenuated hypothalamic inflammation. Neem’s superior effect in regulating feeding may stem from its ability to restore the balance of orexigenic and anorexigenic signals through comprehensive neuroendocrine modulation.
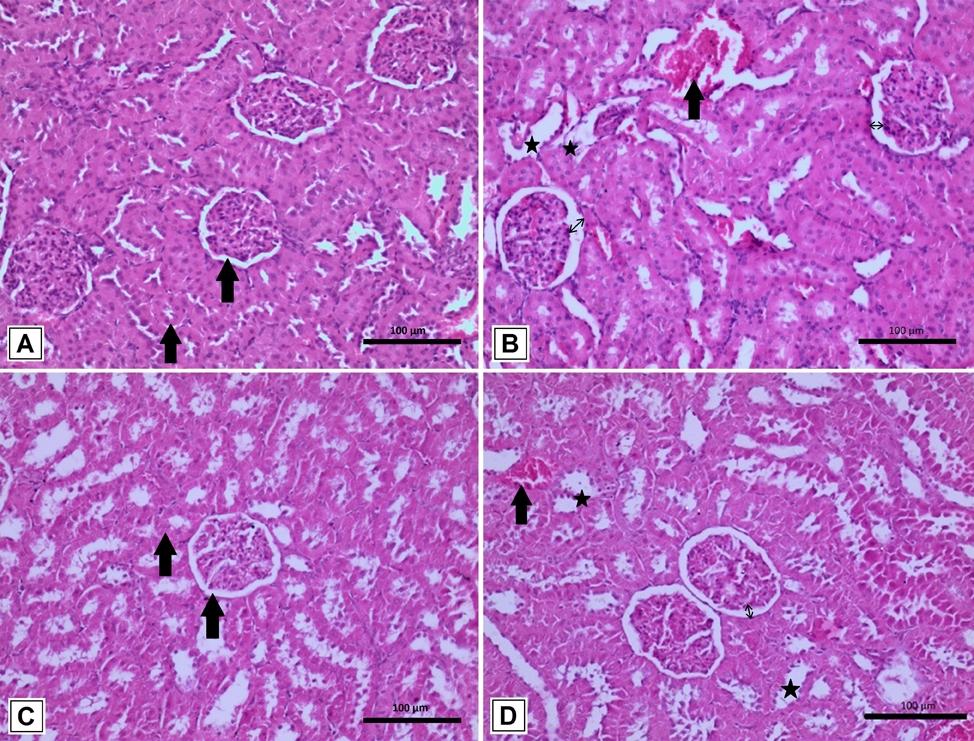
According to Figure 5, histological examination of the hypothalamus substantiated the biochemical and behavioral findings. Diabetic rats showed vacuolated and degenerated hypothalamic nuclei and neuronal cells, consistent with oxidative and inflammatory damage. In contrast, neem-treated rats exhibited well-differentiated neurons and intact nuclei, mirroring the control group. This morphological integrity supports the observed normalization of hormonal and behavioral parameters. Glibenclamide and catechin offered partial histological restoration but retained features like constricted or vacuolated nuclei, suggesting limited neuroprotective capacity compared to etahnolic neem leaf extracted treated group. These differences highlight neem's broader therapeutic spectrum, including direct neuronal protection and enhanced neuroregeneration.
This study underscores the central nervous system's vulnerability in diabetes and highlights the hypothalamus as a critical site of dysfunction. The ability of glibenclamide, catechin, and particularly neem extract to reverse oxidative stress, inflammation, and hormonal dysregulation in the hypothalamus represents a major therapeutic advance. By restoring the structural and functional integrity of hypothalamic neurons, these agents can modulate feeding behavior, prevent diabetic hyperphagia, and contribute to overall metabolic stabilization. ENLE, in particular, offers a holistic therapeutic approach—addressing glycemic control, redox balance, immune modulation, neuroprotection, and behavioral normalization. Its integration into diabetes management protocols could complement conventional treatments, especially in cases involving neuroendocrine complications.
The use of an alloxan-induced model of Type 1 diabetes in male rats may not fully replicate the pathophysiological spectrum of human diabetes, particularly Type 2 diabetes, which involves significant insulin resistance and metabolic heterogeneity. Also, although comprehensive biochemical, hormonal, and histological assessments were conducted, the absence of molecular analyses—such as gene or protein expression of inflammatory and antioxidant pathway markers (e.g., NF-κB, Nrf2, leptin receptor) limits mechanistic understanding.
In alloxan-induced diabetic rats, glibenclamide, catechin, and ENLE demonstrated significant protective and restorative effects on hypothalamic physiology. These agents improved glycemic status, enhanced antioxidant defenses, reduced neuroinflammation, normalized appetite-regulating hormones, corrected feeding behavior, and preserved neuronal architecture. Among them, ENLE showed the most comprehensive efficacy, suggesting its potential as a multi-target therapeutics for managing diabetes-associated central dysfunctions.
Funding: None
Conlflict of Interest: Nil
Subscribe now for latest articles and news.